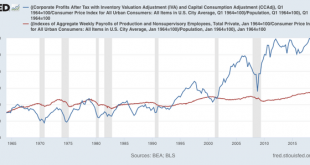
American plutocracy in two simple graphs; plus, when will wage growth bottom? The JOLTS report for February comes out later this morning; I may post on it later or tomorrow. In the meantime, here are updates on several graphs I used to run during the last expansion in order to examine how shared out (or not) economic growth was. First, here is a graph comparing corporate profits adjusted for inflation, and total nonsupervisory wages, also...
Read More » Heterodox

