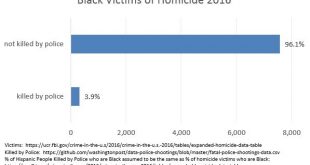
As a follow up to my post on homicides in 2016, I decided to combine homicide data from the FBI with figures from the police shooting database from the Washington Post. The only difficulty is that the FBI classifies people as being from Black, White, Other, or Unknown races, whereas the Washington Post breaks out other groups, such as Hispanic. Because Hispanic people can be Black, White, or Other (as per FBI classfication), it is necessary to assign...
Read More »2016 Homicides
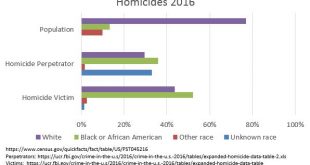
The FBI just released data on homicides for 2016. In light of the various protests by the BLM and now football players, I thought I’d provide a a graph. It breaks out population, homicide perpetrators and homicide victims by race. (click to embiggen) Note… the number of offenders exceeds the number of victims. This is a result of some homicides involving multiple perpetrators. This can happen, for example, if both the shooter and the getaway driver in a...
Read More »Homicides: Victimizers and Victims
Last year in Chicago: Among the Sun-Times’ findings, based on a review of police and Cook County medical examiner’s reports, court files and interviews: • The vast majority of those killed in Chicago in the first half of this year — 90 percent —died from a gunshot wound. • Seventy-two percent were African-American men, their average age 29. • Four out of five had faced criminal charges in Cook County at some point, mostly for drug offenses — the leading...
Read More »More on Police Shootings and Race
In my last post, I linked to a post by Peter Moskos noting that: People, all people, are 1.6 times more likely, per capita, to be shot and killed by police in states that are less than 10 percent black compared to states more than 10 percent African American. Blacks are still more likely than whites, per capita to be shot overall. But this ratio (2.6:1) doesn’t change significantly based on how black a state is. For both whites and blacks, the likelihood of...
Read More » Heterodox


