As a follow up to my post on homicides in 2016, I decided to combine homicide data from the FBI with figures from the police shooting database from the Washington Post. The only difficulty is that the FBI classifies people as being from Black, White, Other, or Unknown races, whereas the Washington Post breaks out other groups, such as Hispanic. Because Hispanic people can be Black, White, or Other (as per FBI classfication), it is necessary to assign Hispanic deaths at the hand of the police to Black, White, or Other to match the FBI figures. One approach would be based on the percentage of Hispanic people who are Black, White, etc. According to the Census, 2.5% of Hispanics are Black. On the other hand, it has been noted that Black people are
Topics:
Mike Kimel considers the following as important: Homicides, police killings, Uncategorized
This could be interesting, too:
tom writes The Ukraine war and Europe’s deepening march of folly
Stavros Mavroudeas writes CfP of Marxist Macroeconomic Modelling workgroup – 18th WAPE Forum, Istanbul August 6-8, 2025
Lars Pålsson Syll writes The pretence-of-knowledge syndrome
Dean Baker writes Crypto and Donald Trump’s strategic baseball card reserve
As a follow up to my post on homicides in 2016, I decided to combine homicide data from the FBI with figures from the police shooting database from the Washington Post. The only difficulty is that the FBI classifies people as being from Black, White, Other, or Unknown races, whereas the Washington Post breaks out other groups, such as Hispanic. Because Hispanic people can be Black, White, or Other (as per FBI classfication), it is necessary to assign Hispanic deaths at the hand of the police to Black, White, or Other to match the FBI figures.
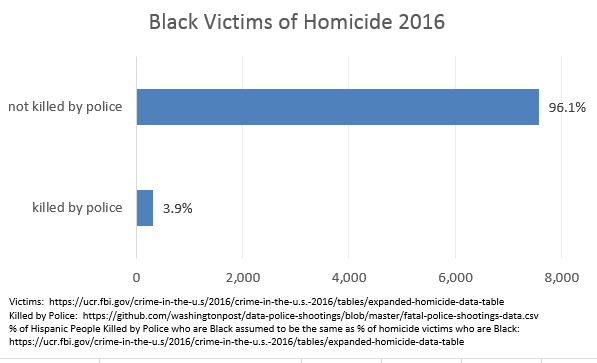
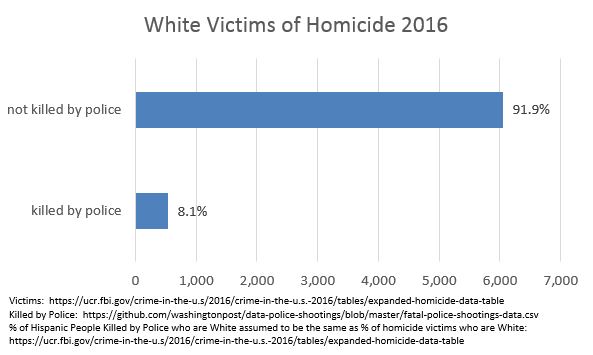
One approach would be based on the percentage of Hispanic people who are Black, White, etc. According to the Census, 2.5% of Hispanics are Black. On the other hand, it has been noted that Black people are disproportionately likely to have negative interactions with Police. In the past few years, that has been the subject of protests. Lacking a perfect way to allocate the Hispanic figures, I assigned them to Black, White, and Other based on their share of the population that were victims of homicides. Its not perfect, and would, if anything, inflate the number of Black people killed by police. But… given the magnitude of the numbers involved, the choice of how to allocate Hispanic deaths among Black and White people will not have much of an effect on the graphs below.
With that said, here is a graph showing the percentage of Black people killed by police v. the percentage of Black people killed by someone other than the police.
(click to embiggen)
Here’s the equivalent graph for White people.
(click to embiggen)
Edit: 9:29/2017, 4:07 AM – added “(click to embiggen)” under each graph.


