In my last post, I linked to a post by Peter Moskos noting that: People, all people, are 1.6 times more likely, per capita, to be shot and killed by police in states that are less than 10 percent black compared to states more than 10 percent African American. Blacks are still more likely than whites, per capita to be shot overall. But this ratio (2.6:1) doesn’t change significantly based on how black a state is. For both whites and blacks, the likelihood of being shot by police is greater in states with fewer blacks. And the difference is rather large. There are seven states less than two percent black. In 2015 and 2016, zero blacks were shot and killed in Maine, New Hampshire, Utah, Vermont, Wyoming, Idaho, and Montana. But if you think cops don’t shoot
Topics:
Mike Kimel considers the following as important: Homicides, income, police shootings, race, State, Uncategorized
This could be interesting, too:
tom writes The Ukraine war and Europe’s deepening march of folly
Stavros Mavroudeas writes CfP of Marxist Macroeconomic Modelling workgroup – 18th WAPE Forum, Istanbul August 6-8, 2025
Lars Pålsson Syll writes The pretence-of-knowledge syndrome
Dean Baker writes Crypto and Donald Trump’s strategic baseball card reserve
In my last post, I linked to a post by Peter Moskos noting that:
People, all people, are 1.6 times more likely, per capita, to be shot and killed by police in states that are less than 10 percent black compared to states more than 10 percent African American. Blacks are still more likely than whites, per capita to be shot overall. But this ratio (2.6:1) doesn’t change significantly based on how black a state is.
For both whites and blacks, the likelihood of being shot by police is greater in states with fewer blacks. And the difference is rather large. There are seven states less than two percent black. In 2015 and 2016, zero blacks were shot and killed in Maine, New Hampshire, Utah, Vermont, Wyoming, Idaho, and Montana. But if you think cops don’t shoot people in these states, you’re wrong. Compared to the four states with the highest percentage of African-American (Mississippi, Louisiana, Georgia, and Maryland are more than 30 percent black), the overall rate of police-involved killings in states with few blacks is higher. And this is despite a lower rate of overall violence.
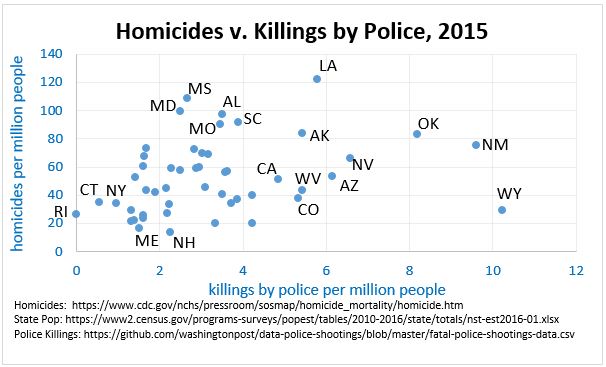
It seems an odd result, so I have given it a bit of thought. I think I know what is happening and will try to provide a bit of an explanation over a few posts. I will start by noting that this is what the homicide rate looks like by state when put against the rate of killings by police:

(Click to embiggen. Note that data sources are shown on the chart.)
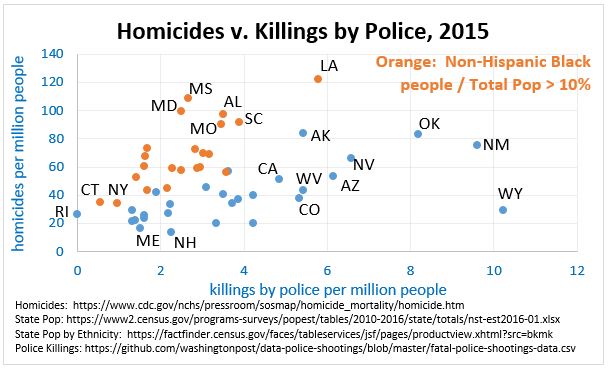
I’ve added labels to some of the points, but of course, there are only so many labels that can be added before the plot looks like a mess. Now… Moskos noted his finding applied to when one differentiated between states with populations > 10% Black v. states with populations < 10% Black. If you look at the graph above, and color states that have a population that is > 10% orange, unless I screwed something up, you get this:

(More click to embiggen & data sources are shown on the chart yadda yadda.)
One comment…. for the Black population as a percentage of the state population I used the Census’ “Race Alone or in Combination - Black or African American” and included both genders, but not those with Hispanic ethnicity. (This was to be compatible with the Washington Post data on killings by police officers.) I then divided by the total state population. Playing around with the data, because the various race classifications were for “alone or in combination” it was possible for the total of all the races to sum to more than 100% of the Census’ figures for the state population.
Anyway, a quick and dirty interpretation: in general, the higher homicide rate in a state, the more likely a person is to get shot by the cops. But, (again in general) for the same state homicide rate, people are less likely to be shot by cops in states where Black people make up 10% or more of the population than in states where people make less than 10% of the population.
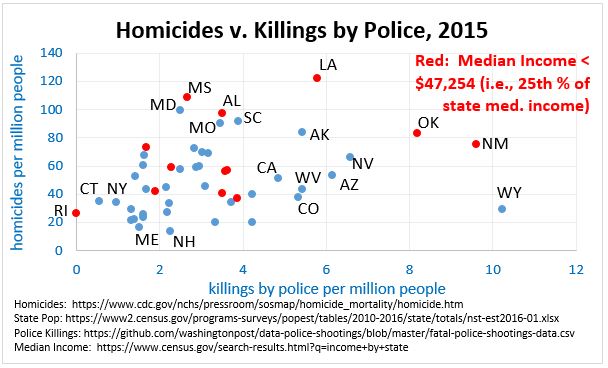
Just to jump the gun, so to speak, the odd relationship between homicides and killings by police noted above does not seem to be driven by income:
(As before, click to embiggen & data sources are shown on the chart.)
Anyway, I’ve collected more data, and there’s still stuff I’m trying to find, but I should have more graphs over the next few whiles or so. Hopefully some positive recommendations about how to reduce homicide rates and killings by police will come out this exercise. The homicide rate in some places is terribly high, and many, many people suffer horribly as a result. Findings ways to reduce the carnage is something that should mater to all of us. Unfortunately, what the data appears to show is not what a very large segment (probably a majority) of the population seems to believe, which will only make it that much harder to come to a solution that can actually work.
As always, if you want my spreadsheet, drop me a line. Based on past experience, I reserve the right to lose my spreadsheet, have a computer crash, have my laptop stolen, die, etc., if the request comes too long after the publication of this post. I can be reached at my first name (mike) dot my last name (there’s only one m in my last name!!!) at gmail with a dot com. Its always possible I’ve made a mistake somewhere, so if I did, please let me know.

