Causal identification requires nonstatistical information in addition to information encoded as data or their probability distributions … This need raises questions of to what extent can inference be codified or automated (which is to say, formalized) in ways that do more good than harm. In this setting, formal models – whether labeled ‘‘causal’’ or ‘‘statistical’’ – serve a crucial but limited role in providing hypothetical scenarios that establish what would be the case if...
Read More »How scientists manipulate research
How scientists manipulate research All science entails human judgment, and using statistical models doesn’t relieve us of that necessity. Working with misspecified models, the scientific value of significance testing is actually zero — even though you’re making valid statistical inferences! Statistical models and concomitant significance tests are no substitutes for doing real science. In its standard form, a significance test is not the kind of ‘severe...
Read More »Analytical strategies in mediation analysis
Analytical strategies in mediation analysis Case 3: Does cognitive skill (M) mediate the relation between college attendance (Z) and earnings (Y)? Case 3 involves one causal variable — college attendance — and two outcomes — one proximal (cognitive skill) and the other distal (earnings). College attendance is causal because a person may or may not go to college. Cognitive skill is not causal because one cannot be assigned or choose to have high skill; it is...
Read More »Joshua Angrist ‘Nobel Prize’ Lecture 2021
Joshua Angrist ‘Nobel Prize’ Lecture 2021 .[embedded content]
Read More »Exchangeability/Unconfoundedness/Ignorability
.[embedded content]
Read More »Interpretation of regression results
Interpretation of regression results When econometric and statistical textbooks present simple (and multiple) regression analysis for cross-sectional data, they often do it with regressions like “regress test score (y) on study hours (x)” and get the result y = constant + slope coefficient*x + error term. When speaking of increases or decreases in x in these interpretations, we have to remember that it is a question of cross-sectional data and ‘increases’...
Read More »Causal mediation and the limits of linear models (student stuff)
Causal mediation and the limits of linear models (student stuff) .[embedded content]
Read More »Proving discrimination
.[embedded content] Spending a couple of hours going through a JEL survey of modern research on the gender wage gap, yours truly was struck almost immediately by how little that research really has accomplished in terms of explaining gender wage discrimination. With all the heavy regression and econometric alchemy used, wage discrimination is somehow more or less conjured away … Trying to reduce the risk of having established only ‘spurious relations’ when dealing with...
Read More »How to get from association to causation — Diversity of Evidence vs RCTs
How to get from association to causation — Diversity of Evidence vs RCTs .[embedded content]
Read More »On mediation and causality
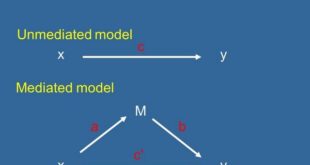
On mediation and causality “Mediation analysis” is this thing where you have a treatment and an outcome and you’re trying to model how the treatment works: how much does it directly affect the outcome, and how much is the effect “mediated” through intermediate variables … In the real world, it’s my impression that almost all the mediation analyses that people actually fit in the social and medical sciences are misguided: lots of examples where the...
Read More » Heterodox


