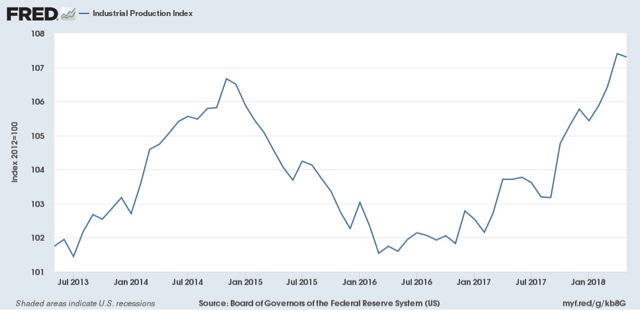
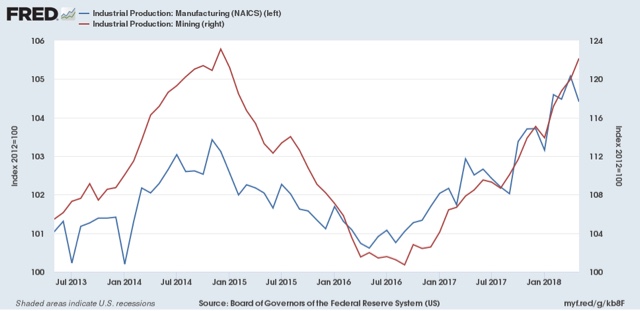
May industrial production: meh Industrial production is the ultimate coincident indicator. It is almost invariably the number that determines economic peaks and troughs. In May it declined -0.1%. While that obviously isn’t a positive, it does nothing to suggest any sort of change of trend: and is in line with any number of similar monthly numbers during the expansion. In this second graph I’ve broken it down into manufacturing (blue, left scale) and mining (red, right scale): Again, there’s nothing here to suggest any change of trend. In particular, the energy production sector of the economy which has done so much to undergird the overall number for the last 9 years, continued to improved. So: meh.
Topics:
NewDealdemocrat considers the following as important: US/Global Economics
This could be interesting, too:
Joel Eissenberg writes How Tesla makes money
Angry Bear writes True pricing: effects on competition
Angry Bear writes The paradox of economic competition
Angry Bear writes USMAC Exempts Certain Items Coming out of Mexico and Canada
May industrial production: meh
In May it declined -0.1%. While that obviously isn’t a positive, it does nothing to suggest any sort of change of trend:
and is in line with any number of similar monthly numbers during the expansion.
In this second graph I’ve broken it down into manufacturing (blue, left scale) and mining (red, right scale):
Again, there’s nothing here to suggest any change of trend. In particular, the energy production sector of the economy which has done so much to undergird the overall number for the last 9 years, continued to improved.
So: meh.


