Further comments about the state of the housing market Here are some additional salient comments about the housing market right now. 1. Existing home sales are completely stagnant Not only did existing home sales fall for the month, not only are they down slightly YoY, but they are now less than 2% higher than where they were 3 years ago: In May 2015, houses sold at a 5.35 million annualized rate. In today’s repot they were reported as selling at a 5.43 million annualized rate. This, of course, is at complete variance to the very positive trend of new home sales over the last three years. 2. Not only sales, but inventories of new vs. existing houses have completely diverged There was a great article this morning on housing over at Barry
Topics:
NewDealdemocrat considers the following as important: US/Global Economics
This could be interesting, too:
Joel Eissenberg writes How Tesla makes money
Angry Bear writes True pricing: effects on competition
Angry Bear writes The paradox of economic competition
Angry Bear writes USMAC Exempts Certain Items Coming out of Mexico and Canada
Further comments about the state of the housing market
Here are some additional salient comments about the housing market right now.
1. Existing home sales are completely stagnant
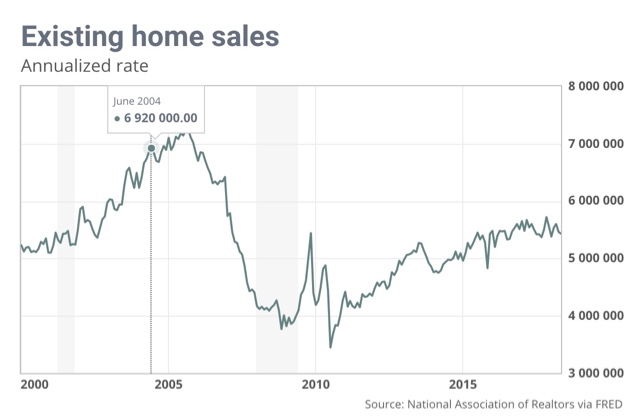
Not only did existing home sales fall for the month, not only are they down slightly YoY, but they are now less than 2% higher than where they were 3 years ago:
In May 2015, houses sold at a 5.35 million annualized rate. In today’s repot they were reported as selling at a 5.43 million annualized rate.
This, of course, is at complete variance to the very positive trend of new home sales over the last three years.
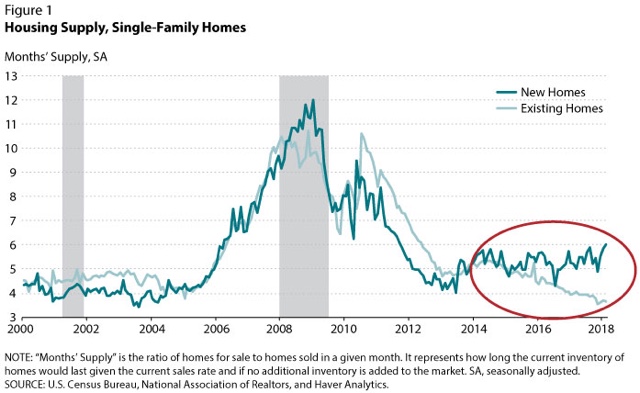
2. Not only sales, but inventories of new vs. existing houses have completely diverged
There was a great article this morning on housing over at Barry Ritholtz’s The Big Picture. Be sure to read it all, but here are a couple of important graphs from the piece.
Inventories of existing houses are continuing to shrink, while inventories of new homes have been slowly rising for the last couple of years:
3, Why the divergence?
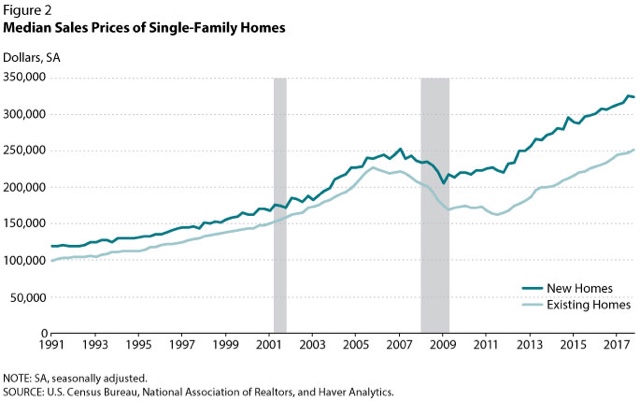
The K.I.S.S. explanation is that *prices* of new and existing homes have been moving roughly in lockstep, up about 6% YoY by nearly any measure, for the last 5 years. Pricewise, they have established a stable equilibrium. Thus, the other measures tend to gravitate back to whatever is necessary for that equilibrium point.
An interesting point that the authors of the article at The Big Picture make is that the price differential between new and existing houses has expanded from 10% to 30% since 2006:
Meanwhile, the size of new houses has increased by 10%. That obviously explains some of the difference, but there is roughly another 20% that isn’t so explained.
4. Foreign buyers?
The one possible explanation that isn’t covered in The Big Picture piece is whether wealthy foreign (mainly Chinese) buyers are driving up the prices of (the relatively luxurious) new houses. I haven’t seen any good articles about this for about three years. At that time it looked like foreign buying might be declining, but maybe it has picked up again since than.
If the profits in new homes are at the luxury end for wealthy foreign buyers with whom in the aggregate domestic buyers can’t compete, that would drive domestic buyers to the “substitute goods” of existing homes. But that same dynamic would mean that *owners* (and potential sellers) of existing homes also, relatively speaking, would be unable to afford selling and moving up to the relatively luxurious new homes. Thus existing home inventory would be capped.
Foreign buying is an excellent fit for the missing part of the puzzle. I just don’t know if it is factually true.
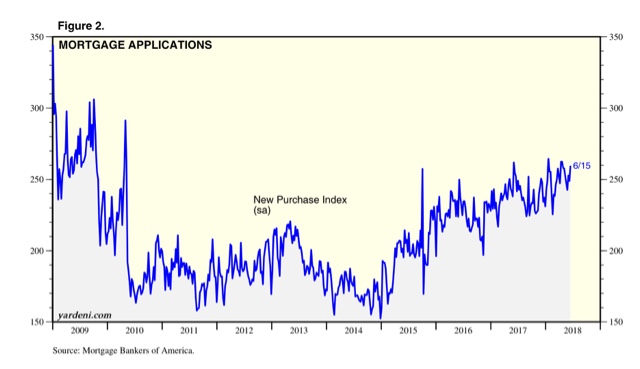
5. In the aggregate, there’s not enough evidence that the housing market is at its peak.
(h/t Ed Yardeni’s blog)
but they are still running, on average this year, roughly 3% higher than their level of last year.
Yesterday I wrote of a poor report for single family housing permits, While I think the preponderance of evidence is that they are on the cusp of at least trending sideways, I should clarify that there have been several times during the last 5 years when permits have pulled back about 4% from the peak. The difference is that the pullback only lasted 2 months and then permits rebounded. This time the decline has lasted 3 months so far, and while we don’t know what the future holds, the fundamentals of interest rates and prices have not improved.


