Gimme Shelter: the rental affordability crisis has worsened Four years ago HUD warned of “the worst rental affordability crisis ever,” citing statistics that About half of renters spend more than 30 percent of their income on rent, up from 18 percent a decade ago, according to newly released research by Harvard’s Joint Center for Housing Studies. Twenty-seven percent of renters are paying more than half of their income on rent. This is a serious real-world issue. I have been tracking rental vacancies, construction, and rents ever since. The Q2 2018 report on vacancies and rents was released a few weeks ago, so let’s take an updated look. In this post I will look at four measures: real median asking rent, as calculated quarterly using the Census
Topics:
NewDealdemocrat considers the following as important: Taxes/regulation, US/Global Economics
This could be interesting, too:
Joel Eissenberg writes How Tesla makes money
Angry Bear writes True pricing: effects on competition
Angry Bear writes The paradox of economic competition
Angry Bear writes USMAC Exempts Certain Items Coming out of Mexico and Canada
Gimme Shelter: the rental affordability crisis has worsened
Four years ago HUD warned of “the worst rental affordability crisis ever,” citing statistics that
About half of renters spend more than 30 percent of their income on rent, up from 18 percent a decade ago, according to newly released research by Harvard’s Joint Center for Housing Studies. Twenty-seven percent of renters are paying more than half of their income on rent.
This is a serious real-world issue. I have been tracking rental vacancies, construction, and rents ever since. The Q2 2018 report on vacancies and rents was released a few weeks ago, so let’s take an updated look. In this post I will look at four measures:
- real median asking rent, as calculated quarterly using the Census Bureau’s American Community Survey
- two rental measures from the monthly CPI reports
- HUD’s quarterly rental affordability index
- Rent Cafe’s monthly rental index
As we will see, regardless of which measure used, rent increases continue to outpace worker’s wage growth, meaning the situation is getting worse. Most likely this is a result of increased unaffordability in the housing market, driving potential home buyers to become or remain renters instead.
Real median asking rent
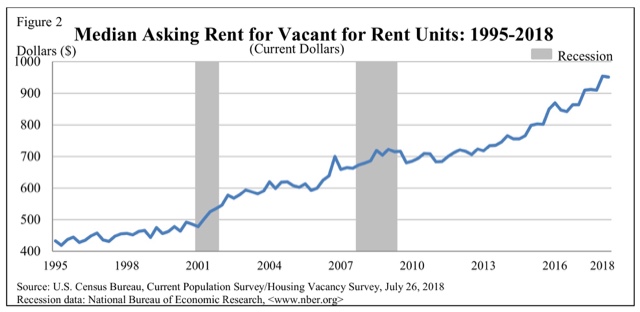
In the second quarter of last year, median asking rents zoomed up over 5% from $864 to $910. In the two quarters since, they have remained at that level:
Here is an updated look at real, inflation adjusted median asking rents. The entires prior to 2009 show the interim high and low values from the previous 20 years. Since 2009, real rents have almost continuously soared — and reached yet another record high in the quarter just ended:
| Year | Median Asking Rent |
Usual weekly earnings |
Rent as % of earnings |
|---|---|---|---|
| 1988 | 330 | 382 | 86 |
| 1992 | 401 | 437 | 92 |
| 1993 | 422 | 450 | 88 |
| 2000 | 478 | 568 | 84 |
| 2002 | 545 | 607 | 90 |
| 2004 | 599 | 629 | 95 |
| 2009 | 680 | 739 | 92 |
| 2012 | 717 | 768 | 93 |
| 2013 | 734 | 778 | 94 |
| 2014 | 762 | 791 | 96 |
| 2015 | 813 | 809 | 100 |
| 2016 | 859 | 832 | 103 |
| 2017 | 896 | 8860 | 104 |
| 2018 Q1 | 954 | 881 | 108 |
| 2018 Q2 | 951 | 876 | 109 |
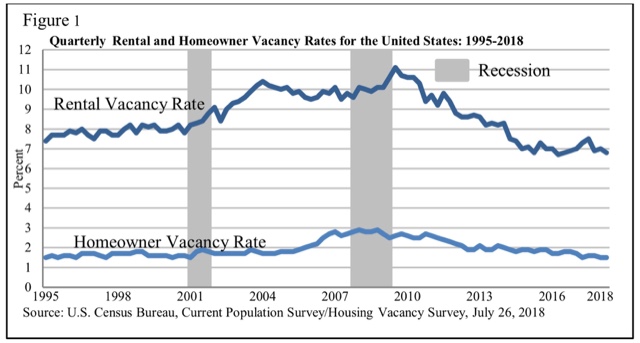
The big increase in unaffordability is unfortunately of a piece with the rental vacancy rate which, after appearing to have bottomed in 2016, tightened again in this report:
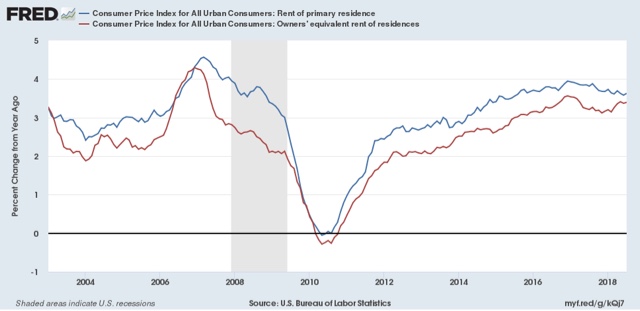
The monhtly CPI report also includes two measures of inflation in rents. The CPI for actual rent (blue) continued an apparent slow deceleration, while owner’s equivalent rent (red), the major component of inflation, remains near the highest levels in a decade, at over 3% YoY:
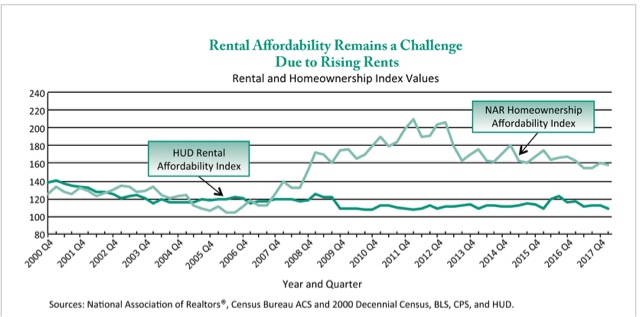
HUD’s Rental Affordability Index
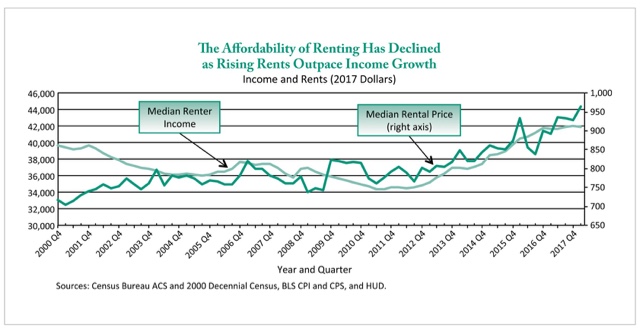
Yet another metric is HUD’s Rental Affordability Index which, similarly to my chart above, compares median renter income with median asking rent. In its most recent (Q1) uupdate, it, like the median household income data, shows both rents and renters’ income bottoming out in 2011-12, but with rents outpacing income ever since:
.
[Paranthetically, I’m not sold on HUD’s method, mainly because it relies upon annual data released with a lag. In other words, the entire last year plus is calculated via extrapolation.]
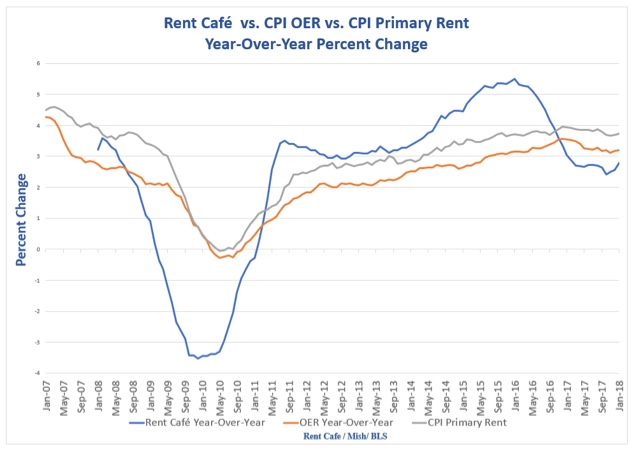
Rent Cafe’s monthly rental index
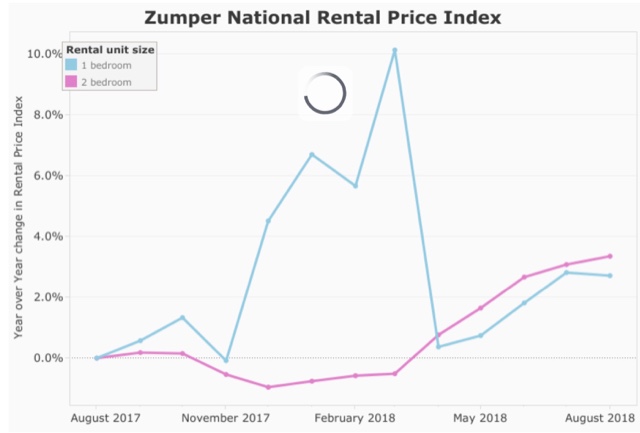
Finally, there is a monthly rental index calculated by Rent Cafe. This has the benefit of being much more timely. Since it is not seasonally adjusted, the index must be compared YoY. While Zumper only includes 12 months of data in their monthly releases, at the beginning of this year they did publish the historical YoY record of their index (blue in the graph below). Rent Cafe’s measure of rent shows that a surge to over 5% increases YoY occurred in 2015 and early 2016, and has abated to less than 4% YoY since, in contrast to the CPI measures and also to HUD’s and the Census Bureau’s data:
Through 2017, their measure of rents was continuing to grow at about 3% YoY. Below are the last 12 months through July:
Here’s the bottom line, from all 4 sources: regardless of which measure we use, rents are growing faster than nominal wages for nonmangerial workers,which have onl increased at 2.7% YoY through last month.
In particular, this quarter’s Census report not only indicates no relief from the “rental affordability crisis,” it, like all the other metrics, shows that it is becoming worse, as — most likely — more and more households are being shut out of the home-buying market due to 5%+ YoY increases in house prices and increased interest rates, and are forced to compete for apartments instead.

