Housing’s most difficult comparisons in years begin next Wednesday After a real quiet week for news, next week we get retail sales, industrial production, the JOLTS report, existing home sales … and housing permits and starts. The week after, real residential fixed investment will be reported as part of Q3 GDP. Permits and residential fixed investments will have some of the most challenging comparisons in a long time. Here’s why. First, here’s a graph of 30 year mortgage rates: These have broken out to highs not seen since early 2011. Here’s what that means for a graph that I have run many times: the inverted YoY change in mortgage rates (blue) vs. the YoY% change in single family permits (red, divided by 10 for scale). I’ve also added 0.75%
Topics:
NewDealdemocrat considers the following as important: Taxes/regulation, US/Global Economics
This could be interesting, too:
Joel Eissenberg writes How Tesla makes money
Angry Bear writes True pricing: effects on competition
Angry Bear writes The paradox of economic competition
Angry Bear writes USMAC Exempts Certain Items Coming out of Mexico and Canada
Housing’s most difficult comparisons in years begin next Wednesday
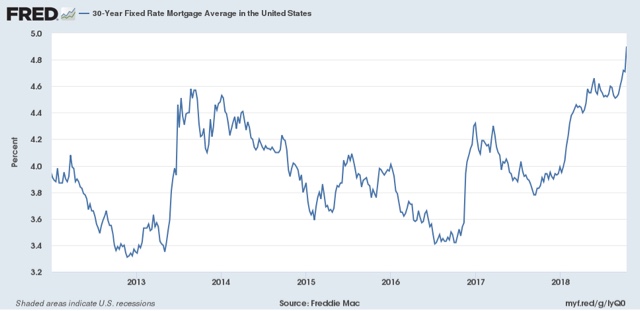
Here’s why. First, here’s a graph of 30 year mortgage rates:
These have broken out to highs not seen since early 2011.
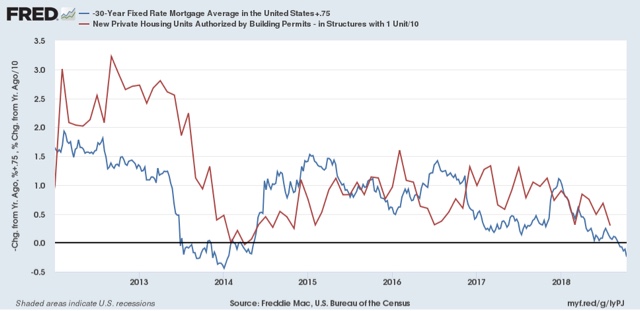
Here’s what that means for a graph that I have run many times: the inverted YoY change in mortgage rates (blue) vs. the YoY% change in single family permits (red, divided by 10 for scale). I’ve also added 0.75% to the inverted YoY number for mortgage rates to account for the positive effect demographics have had on the comparison over the last six years. Remember that permits tend to follow mortgage rates by about 6 months:
In short, even giving the housing market credit for a demographic boost, we are probably going to see the YoY change in building permits for single family houses go to roughly zero. Since (not shown) permits surged between last October and this March, the comparisons will be quite difficult.
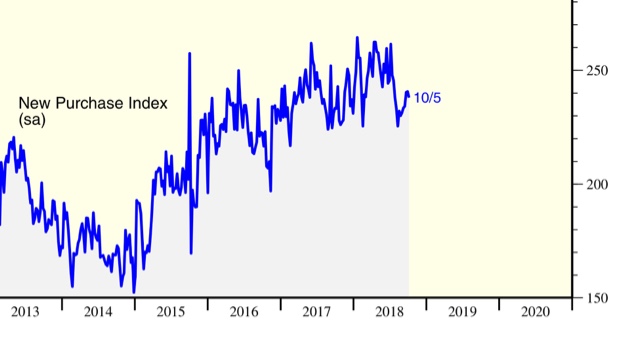
Another housing comparison that is going to get much more challenging starting next week is purchase mortgage applications. Here’s a close-up on those over the last five years from Ed Yardeni’s blog:
For most of the last two months, purchase mortgage applications have been compared with some of the weakest numbers in all of 2017. Beginning with the report next Wednesday morning, for the remainder of the year, almost all of the comparisons except for a couple of weeks will be against index values of 240 or higher (this past week they were reported at 239). And the latest surge in mortgage rates hasn’t really shown up in these yet.
The bottom line is that housing is facing probably the most difficult set of circumstances in that market since prices bottomed in 2012. And the acid test begins next Wednesday.


