Industrial production continues to decelerate Industrial production is the King of Coincident Indicators. In dating the onset and end of recessions, in practice the NBER relies upon industrial production more than any other measure. March 2019 production continued a string of recent disappointments, with overall production declining -0.1%, and manufacturing production unchanged. For the first quarter of 2019 in total, overall production declined -0.3%, and manufacturing declined -0.8%. Here’s the graphic look at the past nine years: Note that the recent flatness is on par with, e.g., 2012, which was nowhere near to recession. But on the other hand, after a surge last summer, leading some to conclude that we were in a “boom,” both total and
Topics:
NewDealdemocrat considers the following as important: Taxes/regulation, US/Global Economics
This could be interesting, too:
Joel Eissenberg writes How Tesla makes money
Angry Bear writes True pricing: effects on competition
Angry Bear writes The paradox of economic competition
Angry Bear writes USMAC Exempts Certain Items Coming out of Mexico and Canada
Industrial production continues to decelerate
Industrial production is the King of Coincident Indicators. In dating the onset and end of recessions, in practice the NBER relies upon industrial production more than any other measure.
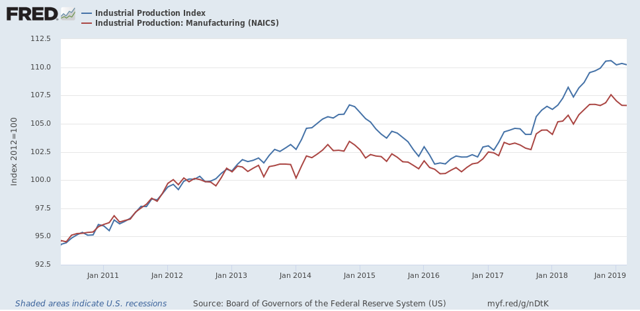
March 2019 production continued a string of recent disappointments, with overall production declining -0.1%, and manufacturing production unchanged. For the first quarter of 2019 in total, overall production declined -0.3%, and manufacturing declined -0.8%. Here’s the graphic look at the past nine years:

Note that the recent flatness is on par with, e.g., 2012, which was nowhere near to recession.
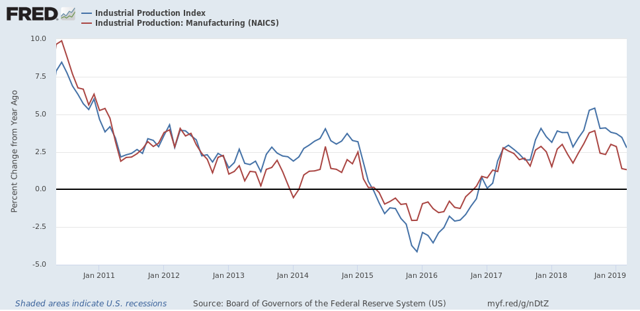
But on the other hand, after a surge last summer, leading some to conclude that we were in a “boom,” both total and manufacturing production have decelerated sharply on a YoY basis. Both levels YoY were last seen in late 2017:

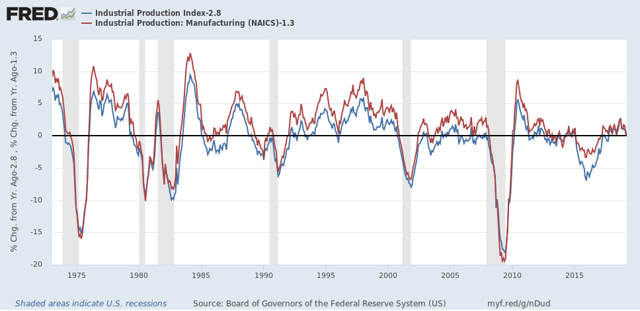
The below graph subtracts the current YoY measure from each of the two so that the current level shows as zero on the historical graph. As of now both are at typical YoY levels for most of this expansion, but at or below YoY levels which in the past have typically been seen during slowdowns, e.g., 1966, 1985, 1996, and 2002, not to mention the “shallow industrial recession” of 2015-16:

In short, by long term historical standards, industrial production is in a slowdown. By the standards of this expansion, it has slowed down from last summer’s “mini-boom” to more normal levels.
