YoY Industrial production and structural changes to the US economy since 1980 No big economic releases today, so let me follow up further with a few long-term comments on industrial production. This series goes back 100 years to the beginning of 1919. Since that time it has turned negative YoY 25 times: Of those 25 times, 17 have been during recessions, sometimes having started shortly beforehand. On only 8 occasions have negative YoY readings not been associated with recessions. That’s better than a 2:1 rate of correct readings vs. false positives, with no false negatives. But it gets better. If you take out the 4 times industrial production has been negative YoY for only one month — July 1954, July 1967, July 1989, and January 2014 — that’s 17
Topics:
NewDealdemocrat considers the following as important: Taxes/regulation, US/Global Economics
This could be interesting, too:
Joel Eissenberg writes How Tesla makes money
Angry Bear writes True pricing: effects on competition
Angry Bear writes The paradox of economic competition
Angry Bear writes USMAC Exempts Certain Items Coming out of Mexico and Canada
YoY Industrial production and structural changes to the US economy since 1980
No big economic releases today, so let me follow up further with a few long-term comments on industrial production.
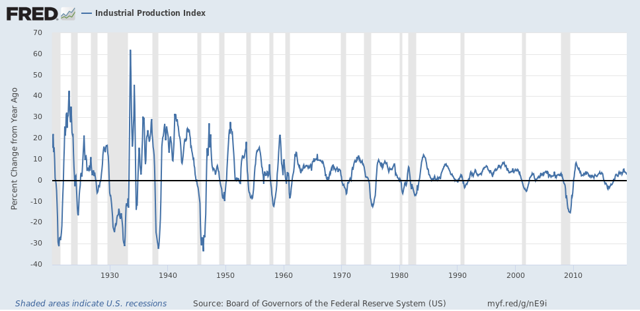
This series goes back 100 years to the beginning of 1919. Since that time it has turned negative YoY 25 times:

Of those 25 times, 17 have been during recessions, sometimes having started shortly beforehand. On only 8 occasions have negative YoY readings not been associated with recessions. That’s better than a 2:1 rate of correct readings vs. false positives, with no false negatives.

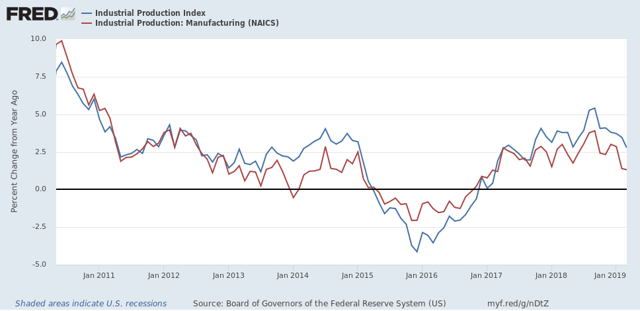
As the above shows, while the Oil patch bore the brunt of that downturn, manufacturing turned down as well. But there was no recession, because the rest of the economy held up.
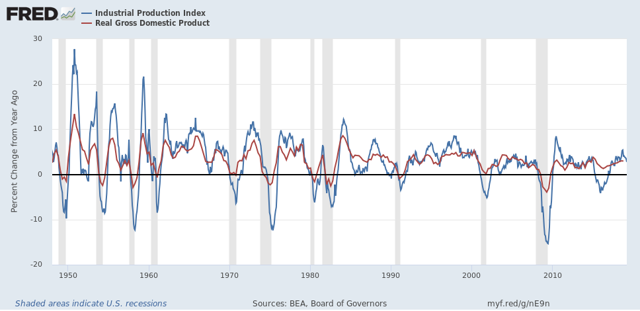
Which brings me to a second point. Here’s the long-term graph of industrial production vs. real GDP, both measured YoY:

Until the 1980s, both moved in tandem. While there were differences in scale in steep downturns or upturns, both moved together.
Since the 1980s, though, there have been lengthy periods of industrial malaise where the economy still remained quite positive: twice in the 1980s, 2002-03, and the recent shallow industrial recession. This reflects the transformation of the US into a service economy.
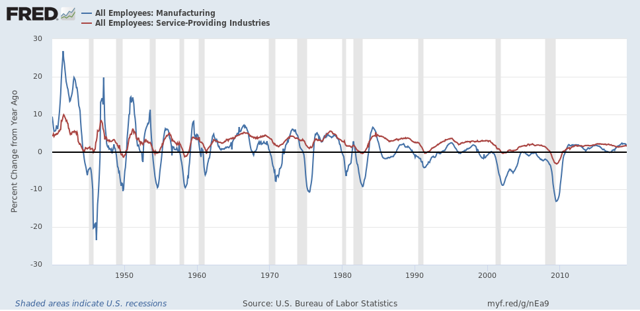
One of the things that made the “Great Recession” so “great” was that it had the biggest ever downturn in jobs in the services sector, over -3%:

No other recession in the past 70 years even came close. In the runner-up, 1949, only -1.4% of services jobs were lost YoY.
The difference in manufacturing vs. service jobs and the fact that the big industrial production declines in 2015-16 failed to produce a recession together show us how much the economy has changed since 1980.
