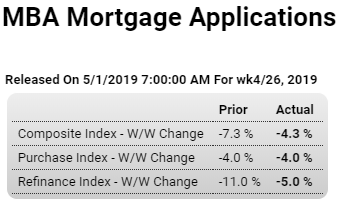
Dismal: Highlights The purchase index is down a sharp 4.0 percent for a second straight week, this time for the April 26 week. Year-on-year, the index is up only 1.0 percent which is not a favorable signal for the Spring housing push. Refinancing is also coming down, 11.0 percent lower for the fourth straight weekly decline after having spiked dramatically on a break lower in mortgage rates. And rates are still very low, down 4 basis points in the week for 30-year conventional loans to an average 4.42 percent. March was a very strong month for the housing market, evidenced not only by prior data on the month’s new and existing home sales but also yesterday’s surprisingly strong jump in the month’s pending home sales index. Yet April, based at least on this report’s
Topics:
WARREN MOSLER considers the following as important: Economic Releases
This could be interesting, too:
WARREN MOSLER writes Consumer sentiment, real retail sales, industrial production, wages
WARREN MOSLER writes New manufacturers orders, vehicle sales, unemployment claims, rents, oil prices
WARREN MOSLER writes Saudi price hike, private payrolls, new hires, corporate profits
WARREN MOSLER writes Pending home sales, Durable goods orders, oil rigs and production
Dismal:

Highlights
The purchase index is down a sharp 4.0 percent for a second straight week, this time for the April 26 week. Year-on-year, the index is up only 1.0 percent which is not a favorable signal for the Spring housing push. Refinancing is also coming down, 11.0 percent lower for the fourth straight weekly decline after having spiked dramatically on a break lower in mortgage rates. And rates are still very low, down 4 basis points in the week for 30-year conventional loans to an average 4.42 percent.
March was a very strong month for the housing market, evidenced not only by prior data on the month’s new and existing home sales but also yesterday’s surprisingly strong jump in the month’s pending home sales index. Yet April, based at least on this report’s purchase index, looks to have slowed significantly.
Dismal:

Highlights
Construction spending came in much weaker than expected in March, down 0.9 percent on the month and well under Econoday’s consensus range. Weakness is centered in the most sensitive spot of all: single-family homes where spending fell 1.5 percent in what may point to a downward revision to what was already a weak residential component in the first-quarter GDP report.
Private nonresidential spending did better, rising a solid 0.5 percent led by gains for manufacturing and transportation which may lift the GDP revision for first-quarter business investment. Yet spending on commercial projects remains weak, down 2.6 percent in the month with this year-on-year rate well into contraction at minus 8.6 percent.
Public spending has been holding up this report but showed sharp give backs in March, down a monthly 1.5 percent for educational projects and down 1.9 percent for highways & streets. Federal spending fell 2.7 percent in the month with state & local down 1.1 percent, though year-on-year gains are still strong at 5.7 percent for Federal and 8.9 percent for state & local.
Overall construction was down 0.8 percent on the year in March in a measure that is not pointing to improvement yet for 2019. Housing sales did show solid signs of pick-up in February and March as mortgage rates came down, but today’s results for single-family spending aren’t promising much new supply for the new home market. And in an unfavorable indication on discretionary spending and demand for building materials, spending on home improvements fell 3.1 percent in the month with this yearly rate deep in contraction at minus 14.1 percent.

San Francisco Bay Area home prices fall for the first time in 7 years
The global deceleration from the trade war includes the US:

Highlights
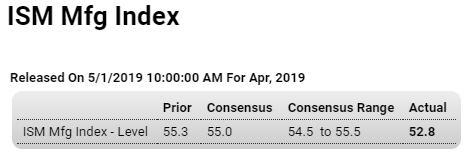
In the weakest report in nearly two years, the April ISM manufacturing index came in far below expectations at 52.8 for a 2.5 point decline from March. New orders, at 51.7, are down 5.7 points in April with related export orders down 2.2 points and in technical contraction at 49.5. Employment fell 5.3 points to 52.4 in what is an unfavorable indication for Friday’s factory payroll data where a solid gain was expected. The significant slowing in demand is reflected in the prices paid index which fell 4.3 points to 50.0 even to indicate no change from the prior month.
But there are pluses in the report including a 3.5 point rise in total backlog orders to 53.9 which is solid for this reading and which will help the sample keep up their production despite the slowing in new orders. Of the 18 industries tracked in the report, 13 reported monthly growth in composite activity with five, which is a large number for the breakdown, reporting contraction led by apparel makers and also including primary metals and, in an unfavorable indication for April durable goods orders, transportation equipment as well.
This report is focused on strongly by not only forecasters and policy makers but also by the financial markets. Though one month is only one month, the results are likely to raise talk that the performance of the nation’s factory sector, which has been uneven since late last year, may begin holding back the 2019 economy.

The red line, as above, is down further in April:

Some were saying this was what the US was trying to achieve and was willing to drop most of the rest to get it:
Trump drops cyber theft demands in bid for swift trade deal with China
(FT) President Trump has dropped a central demand from trade negotiations with China that it halt alleged instances of commercial cyber theft, in order to end a long-running tariff dispute. The US is instead likely to accept a watered-down commitment from Beijing as an alternative.
Tariffs That Started the U.S.-China Trade Conflict Now Dog Its Finish
(WSJ) As U.S. and Chinese officials try to close a trade deal, the punitive tariffs the governments slapped on each country’s goods in the conflict stand as a major obstacle, according to officials and others briefed on the talks.


