This is what exponential growth looks like: 2,500,000 infected in the next 15 days, 50,000 deaths I had originally planned on limiting this post to the next 10 days. But then the Buffoon-in-Chief tweeted this: So let’s look at the number of diagnosed infections and deaths in the US by the time Trump gets around to deciding what to do. Bottom line: about 2.5 million *diagnosed* infections, and about 50,000 deaths baked in the cake at a 2% mortality rate, if the current exponential rate of spreading continues. Let me start by revisiting Jim Bianco’s March 10 graph one last time. At the time he put up the graph, there were 959 diagnosed coronavirus cases in the US: That’s the information he had to work with. He deduced an exponential growth rate of
Topics:
NewDealdemocrat considers the following as important: Healthcare, US/Global Economics
This could be interesting, too:
Bill Haskell writes Families Struggle Paying for Child Care While Working
Joel Eissenberg writes How Tesla makes money
Joel Eissenberg writes RFK Jr. blames the victims
Angry Bear writes True pricing: effects on competition
This is what exponential growth looks like: 2,500,000 infected in the next 15 days, 50,000 deaths
I had originally planned on limiting this post to the next 10 days. But then the Buffoon-in-Chief tweeted this:
So let’s look at the number of diagnosed infections and deaths in the US by the time Trump gets around to deciding what to do. Bottom line: about 2.5 million *diagnosed* infections, and about 50,000 deaths baked in the cake at a 2% mortality rate, if the current exponential rate of spreading continues.
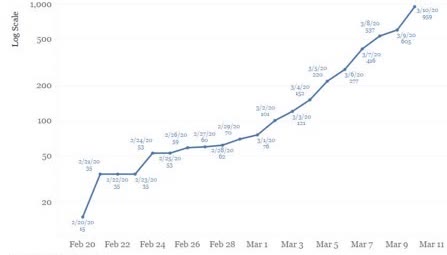
Let me start by revisiting Jim Bianco’s March 10 graph one last time. At the time he put up the graph, there were 959 diagnosed coronavirus cases in the US:

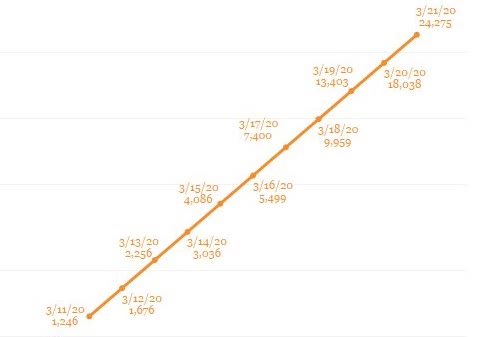
That’s the information he had to work with. He deduced an exponential growth rate of 34.6% per day. Using that, he projected that over the next 10 days ending March 21, there would be 24,275 diagnosed cases:
Since then, I have pointed out how close to accurate those projections were. I’ll spare you the day by day count, but now that we have the actual numbers, here’s the actual vs. projected cases as of March 21:
Projected: 24,275
Actual: 26,747
Bianco’s projections weren’t perfect, but they were stunningly close.
So now let’s take that same 34.6% growth rate and project it forward 15 days, starting with the actual March 21 number:
Mar 22: 36,001 (Actual as of this morning: 35,224)
Mar 23: 48,458
Mar 24: 65,224
Mar 25: 87,792
Mar 26: 118,168
Mar 27: 159,054
Mar 28: 232,219
Mar 29: 312,567
Mar 30: 420,715
Mar 31: 566,283
Apr 1: 762,217
Apr 2: 1,025,944
Apr 3: 1,380,920
Apr 4: 1,858,719
Apr 5: 2,501,836
2% of the April 5 number is 50,037. That number won’t appear for another week or two later, because of the lag between onset of infection and death, but it will be, as I said above, “baked in the cake.”
That’s where the US will be, if the current exponential growth rate of diagnosed coronavirus infections continues, when Trump finally gets around to “deciding” what to do. Hopefully, since “social distancing” really took off about 10 days ago, later on this week we’ll see it starting to have a downward impact on the trajectory of this growth.
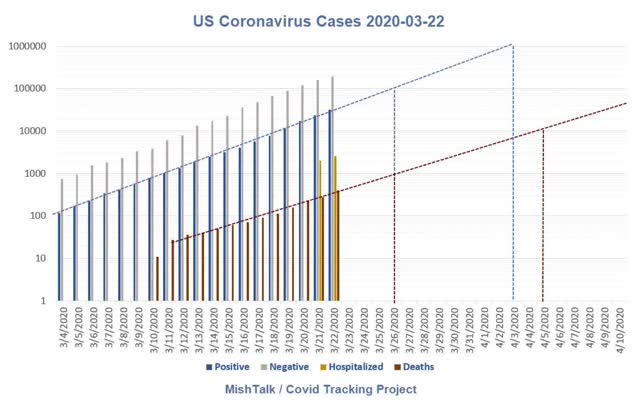
By the way: while Bianco hasn’t updated his graph, this morning Mike Sherlock a/k/a Mish, did a nice exponential extrapolation of actual cases. Here it is:
He has cases crossing the 1 million threshold on April 3 rather than April 2.
I have criticized Shedlock’s economic analysis many times, but I have always appreciated that he takes a deep dive into the numbers. Hats off for this graph.


