The current trend in both cases and deaths in the US has me the most hopeful I have been in over 6 months. Here’s why. Nationwide, cases have declined to 150,000, only 30,000 above their level just before The Omicron wave started, and about 10,000 less than their Delta peak: The Omicron wave has been almost completely symmetrical. Cases started to rise exponentially roughly on December 15. They peaked about 4.5 weeks later. Now, about 4.5 weeks after that, if the current trend continues the US will be below its level of December 15 within a week from now. Meanwhile, deaths have declined slightly to 2300 from their peak of roughly 2500 a week and a half ago. Further, in a comparative sense only, Omicron has been milder than previous waves,
Topics:
NewDealdemocrat considers the following as important: Featured Stories, Healthcare, omicron, US EConomics
This could be interesting, too:
NewDealdemocrat writes JOLTS revisions from Yesterday’s Report
Ken Melvin writes A Developed Taste
Bill Haskell writes The North American Automobile Industry Waits for Trump and the Gov. to Act
Bill Haskell writes Families Struggle Paying for Child Care While Working
The current trend in both cases and deaths in the US has me the most hopeful I have been in over 6 months. Here’s why.
Nationwide, cases have declined to 150,000, only 30,000 above their level just before The Omicron wave started, and about 10,000 less than their Delta peak:
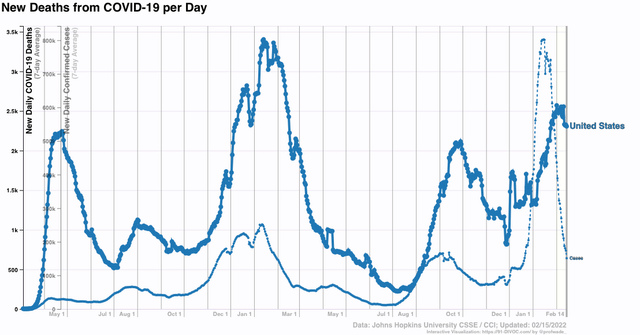
The Omicron wave has been almost completely symmetrical. Cases started to rise exponentially roughly on December 15. They peaked about 4.5 weeks later. Now, about 4.5 weeks after that, if the current trend continues the US will be below its level of December 15 within a week from now. Meanwhile, deaths have declined slightly to 2300 from their peak of roughly 2500 a week and a half ago. Further, in a comparative sense only, Omicron has been milder than previous waves, with more than 3x the number of infections at the US’s previous peak one year ago, but 25% fewer deaths, and only about 20% higher than their Delta peak. Still, as the graph shows, the US currently is at a level far above its summertime 2020 and 2021 levels.
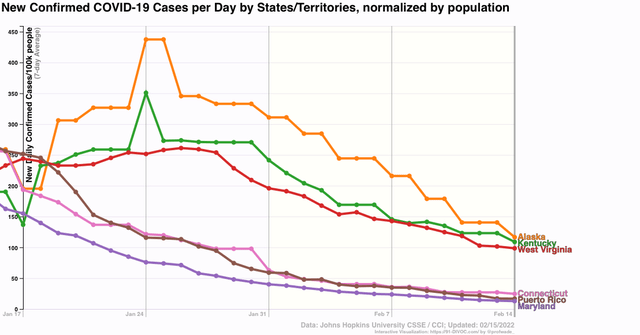
As usual, there is a big divergence among the States in the course of the current wave. The worst States are still reporting over 100 cases per 100,000 population daily. the best, plus Puerto Rico, are between 12 to 25 cases per 100,000:
More granularity, here’s a list, plus relevant exemplar graphs, of where the 50 States plus DC and Puerto Rico fit in.
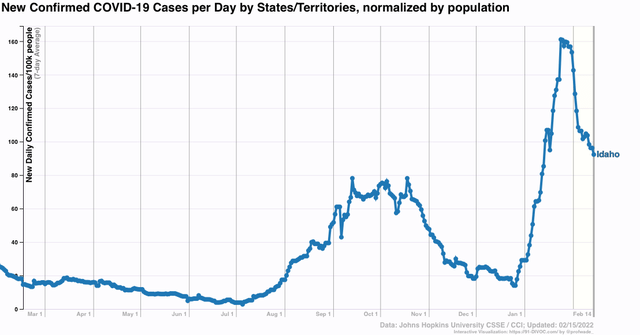
(1) State with less than a 50% decline: ID
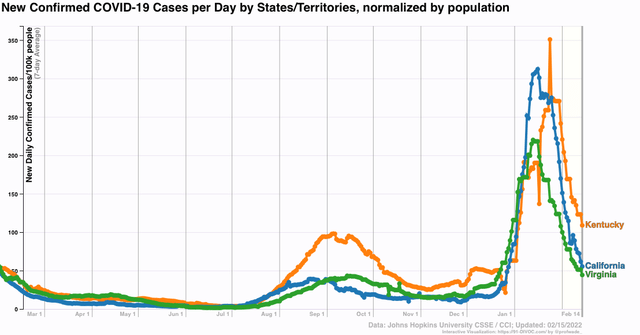
(9) States with greater than 50% declines, but still above their Delta peak: AZ, CA, KY, MT, NM, NC, OR, VA, WA
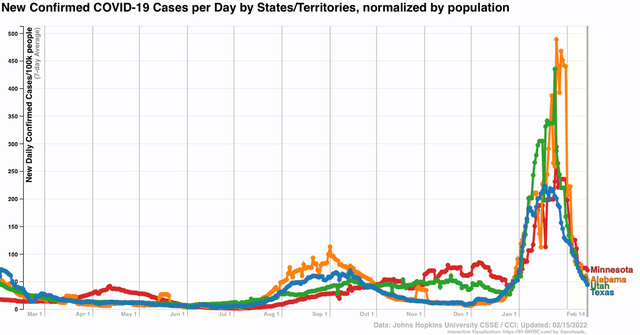
(22) States below their Delta peak, but not below their level pre-Omicron: AL. AK, AR, CO, FL, GA, HI, KS, LA, MN, MS, MO, NV, ND, OK, PR, SC, TN, TX, UT, WV, WY
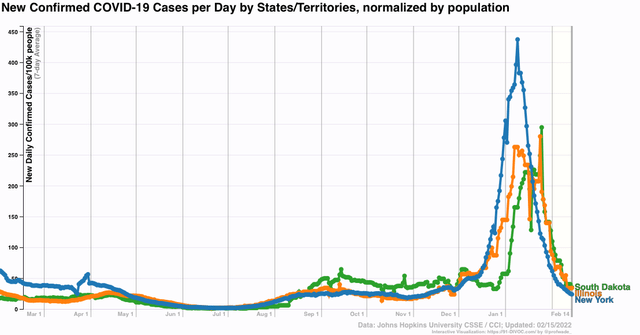
(16) States below their level pre-Omicron: CT, DE, DC, IL, IN, IA, MD, MS, NE, NH, NJ, NY, RI, SD, VT, WI
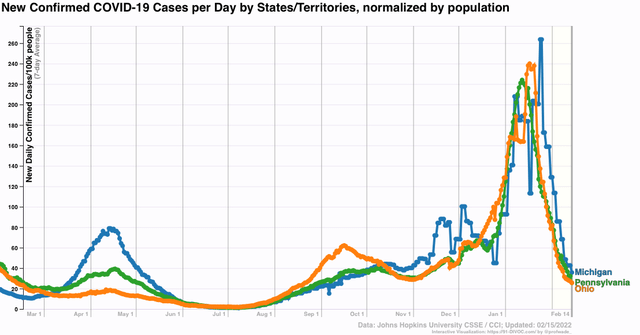
(3) States below both their pre-Omicron and pre- Delta onset levels: MI, OH, PA
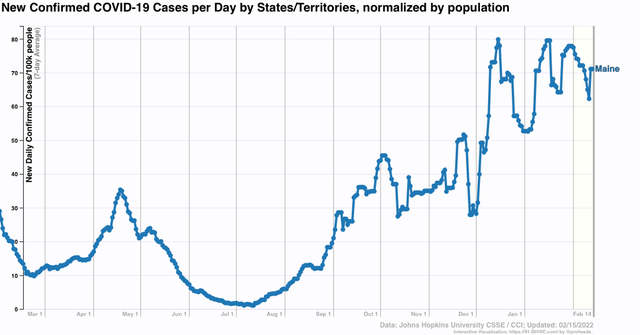
(1) sui generis: ME, which never really had an Omicron wave, but was caught in the middle of its Delta wave when Omicron hit:
Finally, let’s take another look at cases and deaths per capita in the US focused on the last 8 weeks:
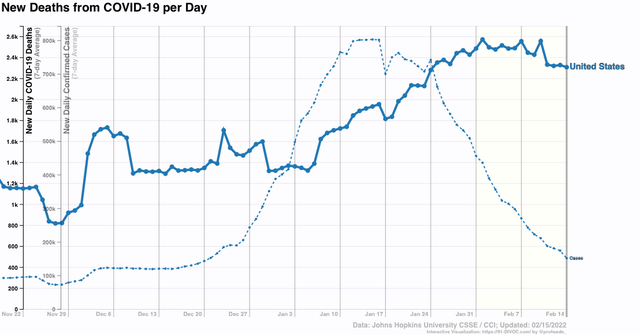
Cases have been declining at roughly 40% per week. *If* they continue to decline at that rate, the US is going to be completely below its pre-Omicron level within a week, and back to its summertime 2020 and 2021 levels within 3 weeks.
Further, the CDC’s latest report shows that Omicron has all but eliminated Delta, which was responsible for 0.0% of cases (!) in their latest weekly report. In other words, there is every reason to believe that deaths, which have lagged cases by about 3 weeks or so since the onset of Omicron, are going to fall all the way to about 500 per day by March 10.
This is about the best, most hopeful data trend I have seen since the Delta wave started last July. Half a year ago, I thought that once Delta had burned through all the dry tinder, and once vaccinations increased enough, by this spring we might be returning to something at least close to normal. It may very well be that Omicron wound up doing the deed instead. If so, I certainly expect more variants and more waves; but it could very well be that future waves are going to be significantly smaller than either Delta or Omicron, especially in terms of deaths.
