– by New Deal democrat This morning’s personal income and spending report for August was positive month over month both in nominal and real terms, but the major story was in the revisions. Personal spending is the essentially the opposite side of the transaction of retail sales. Both have been tracking relatively closely since the end of the stimulus-fueled spring spending spurge of 2021, as shown in the m/m% changes below: Real personal spending was up +0.1% in August, compared with +0.2% for real sales. So far, so good. But as you can see from the above graph, real personal spending has all but stalled since April. Compared with the average spending in Q2, the first two months of Q3 are only up +0.1% – which while positive is
Topics:
NewDealdemocrat considers the following as important: US EConomics
This could be interesting, too:
NewDealdemocrat writes JOLTS revisions from Yesterday’s Report
Bill Haskell writes The North American Automobile Industry Waits for Trump and the Gov. to Act
Bill Haskell writes Families Struggle Paying for Child Care While Working
Joel Eissenberg writes Time for Senate Dems to stand up against Trump/Musk
– by New Deal democrat
This morning’s personal income and spending report for August was positive month over month both in nominal and real terms, but the major story was in the revisions.
Personal spending is the essentially the opposite side of the transaction of retail sales. Both have been tracking relatively closely since the end of the stimulus-fueled spring spending spurge of 2021, as shown in the m/m% changes below:
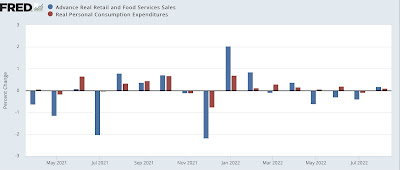
Real personal spending was up +0.1% in August, compared with +0.2% for real sales.
So far, so good. But as you can see from the above graph, real personal spending has all but stalled since April. Compared with the average spending in Q2, the first two months of Q3 are only up +0.1% – which while positive is seriously weak.
Real personal income also increased less than +0.1%, rounding down to unchanged. Since May 2021, real spending has increased +2.8%, but real personal income is *down* -2.2%:
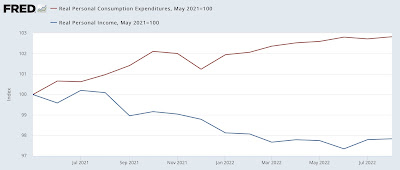
This reflects a major downward revision in income for the past year. Here’s last month’s graph, showing real personal income only down -1.0% since May 2021:
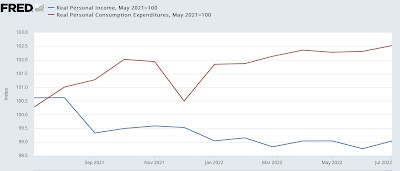
With this revision, we just got a big part of the explanation for why consumer confidence (and President Biden’s approval ratings) took such a hit earlier this year.
The same revision seriously affected the personal saving rate, which was unchanged for the month at 3.5% (shown as zero in the graph below for better historical comparison):
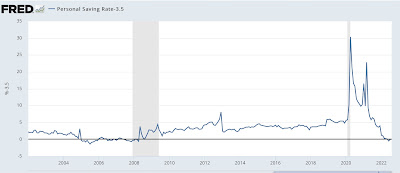
As revised, the saving rate has been close to all time lows for most of this year. Only 2005-08 were lower.
Here’s the same graph from one month ago, showing July’s saving rate as 5.0%, generally equivalent to the early 2000s:
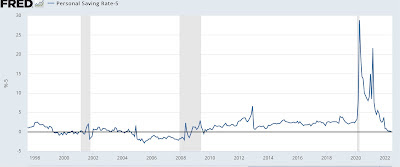
But no more!
Usually the personal saving rate declines progressively during expansions, leaving consumers more and more vulnerable to negative shocks. With the revisions to the past year’s data, we are very much in that territory. If there is , e.g., another gas price spike, consumers’ luck will probably run out.
