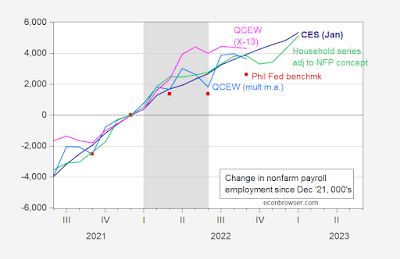
The “gold standard” of jobs data shows a strong rebound in Q3 2022 – by New Deal democrat The preliminary estimate for the Q3 2022 QCEW was released yesterday. Although the monthly nonfarm payrolls report gets all the glory, it is only a survey. The QCEW is an actual census of the roughly 95% of all businesses paying unemployment insurance. It is reported with about a 6 month delay, and is not seasonally adjusted. The bottom line is while Q2 was very weak, it was followed by a strong Q3. My take is essentially that shown on the dot plot below for the Philadelphia Fed, via Prof. Menzie Chinn at Econbrowser: Just “how” weak and strong they are depends entirely on how one seasonally adjusts. Generally speaking, June was extremely weak, only
Topics:
NewDealdemocrat considers the following as important: Hot Topics, politics, Strong Q3 2022 QCEW, US EConomics, Weak Q2 2022 QCEW
This could be interesting, too:
Robert Skidelsky writes Lord Skidelsky to ask His Majesty’s Government what is their policy with regard to the Ukraine war following the new policy of the government of the United States of America.
NewDealdemocrat writes JOLTS revisions from Yesterday’s Report
Joel Eissenberg writes No Invading Allies Act
Ken Melvin writes A Developed Taste
The “gold standard” of jobs data shows a strong rebound in Q3 2022
– by New Deal democrat
The preliminary estimate for the Q3 2022 QCEW was released yesterday. Although the monthly nonfarm payrolls report gets all the glory, it is only a survey. The QCEW is an actual census of the roughly 95% of all businesses paying unemployment insurance. It is reported with about a 6 month delay, and is not seasonally adjusted.
The bottom line is while Q2 was very weak, it was followed by a strong Q3. My take is essentially that shown on the dot plot below for the Philadelphia Fed, via Prof. Menzie Chinn at Econbrowser:

Just “how” weak and strong they are depends entirely on how one seasonally adjusts. Generally speaking, June was extremely weak, only better than 2009 since the turn of the Millennium, while July was extremely strong only weaker than 2020 and 2021. The two months together are also stronger than any year since 2001 except for 2020 and 2021. More on that below.
But first, here is my big problem: I continue to be concerned about why the QCEW, which is the gold standard, is so consistently below the YoY% growth comparisons in the CES survey for an entire year (so far) beginning in September 2021.
Here is the YoY% change in the QCEW monthly beginning in 2020:

And here is the same data for private nonfarm payrolls:

As I wrote above, note that in September 2021 the YoY% change in the QCEW is 4.8%, while that for nonfarm payrolls is 4.9%. That’s no big deal, but the overperformance of the private nonfarm payroll survey continued to intensify all through 2022 until in June there was a 1.3% divergence, with the QCEW only up 4.0% YoY, but private nonfarm payrolls up 5.3%. That continued through the latest QCEW data for the Third quarter of 2022.
Let’s see how various methods of seasonally adjusting affect the monthly data.
If I take CES seasonally adjusted data through March 2021 as gospel, and apply the QCEW YoY% growth rates starting with that, I get a Q2 that only adds 45,000 jobs in total, but then a roaring Q3 that adds 884k jobs in July, 750k in August, and 733k in September.
On the other hand, if I take the QCEW numbers for each month of Q3, compare with the closest matching QCEW numbers in the 20 previous years, and then average how the CES seasonally adjusted those numbers, I get +1.2-1.3M in July, but only about +175k in August and +150k in September.
The first method gives me a seasonally adjusted CES # of +2,367,000 jobs added in Q3, while the second gives me only +1.7M jobs added.
Finally, if I were to follow my rule of thumb for non-seasonally adjusted data, which is that a decline of 50% or more in the growth rate within 12 months means that the data has actually turned negative, it shows that both April (5.0% vs. 11.7% in 2021) and May (4.7% vs. 9.7%) probably had actual job losses, followed by a recovery afterward.
The big discrepancy between the two measures may be an issue of very strong solo proprietor new business formations (since the self-employed don’t pay unemployment insurance), but the Census Bureau really ought to address this ongoing issue.
