New home sales for February increase; likely bottomed last July – by New Deal democrat Most of what you probably read elsewhere focuses on new home prices, which after finally declining -0.7% YoY in January, rebounded to +2.5% YoY. As is usual, prices follow sales YoY with a considerable lag (note since prices are not seasonally adjusted, this is the right way to make the comparison): In fact if you’ve been reading me and following my rule of thumb, the peak occurred months ago, once the YoY gains had decelerated by over 50%. But the most important news was actually in the seasonally adjusted sales, which at 640,000 annualized increased 7,000 from a seriously downwardly revised (by -37,000) January. Big deal, you say? Here’s a graph of
Topics:
NewDealdemocrat considers the following as important: Hot Topics, US EConomics
This could be interesting, too:
NewDealdemocrat writes JOLTS revisions from Yesterday’s Report
Joel Eissenberg writes No Invading Allies Act
Bill Haskell writes The North American Automobile Industry Waits for Trump and the Gov. to Act
Bill Haskell writes Families Struggle Paying for Child Care While Working
New home sales for February increase; likely bottomed last July
– by New Deal democrat
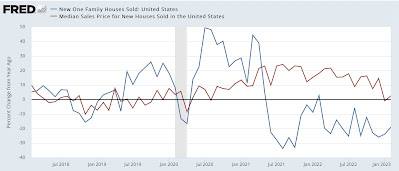
Most of what you probably read elsewhere focuses on new home prices, which after finally declining -0.7% YoY in January, rebounded to +2.5% YoY. As is usual, prices follow sales YoY with a considerable lag (note since prices are not seasonally adjusted, this is the right way to make the comparison):

In fact if you’ve been reading me and following my rule of thumb, the peak occurred months ago, once the YoY gains had decelerated by over 50%.
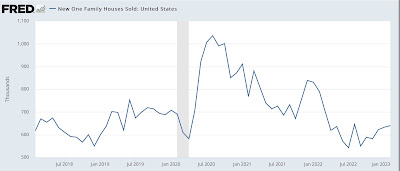
But the most important news was actually in the seasonally adjusted sales, which at 640,000 annualized increased 7,000 from a seriously downwardly revised (by -37,000) January. Big deal, you say? Here’s a graph of the last several years:

While revisions can still be made to the last several months, it is apparent that the bottom for new home sales was last July, at 543,000 annualized. There has been an almost consistent monthly increase since.
This joins existing home sales, which likely bottomed in December; and housing permits and the three month average of starts, both of which possibly bottomed in January. As I’ve written many times before, while new home sales are very noisy and heavily revised, they are frequently the first housing data to turn. And it appears they have.
New home sales: a bright spot in the housing indicators, Angry Bear, New Deal democrat
