– by New Deal democrat There are some economic and financial indicators that aren’t classic leading or lagging indicators. Rather, they are “over-sensitive” in one direction or another. Two good examples are heavy truck sales and the unemployment rate: they are over-sensitive to the downside: they lead going in to recessions, but lag coming out. The S&P 500 stock market index fits in this category as well. The classic aphorism is “the stock market has predicted 9 of the last 4 recessions.” But the converse is not true. With the stellar exception of 1929, when stocks themselves were in a bubble, if the market makes a new high, it’s almost a sure bet that the economy is not in a recession. Here is the (almost) 100 year graph of the S&P 500
Topics:
NewDealdemocrat considers the following as important: No Recession, politics, US EConomics
This could be interesting, too:
Robert Skidelsky writes Lord Skidelsky to ask His Majesty’s Government what is their policy with regard to the Ukraine war following the new policy of the government of the United States of America.
NewDealdemocrat writes JOLTS revisions from Yesterday’s Report
Joel Eissenberg writes No Invading Allies Act
Ken Melvin writes A Developed Taste
– by New Deal democrat
There are some economic and financial indicators that aren’t classic leading or lagging indicators. Rather, they are “over-sensitive” in one direction or another. Two good examples are heavy truck sales and the unemployment rate: they are over-sensitive to the downside: they lead going in to recessions, but lag coming out.
The S&P 500 stock market index fits in this category as well. The classic aphorism is “the stock market has predicted 9 of the last 4 recessions.”
But the converse is not true. With the stellar exception of 1929, when stocks themselves were in a bubble, if the market makes a new high, it’s almost a sure bet that the economy is not in a recession.
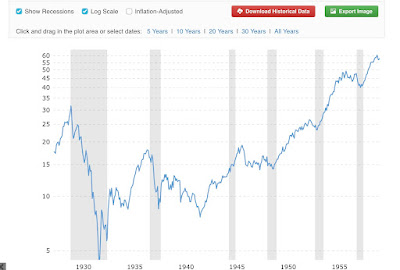
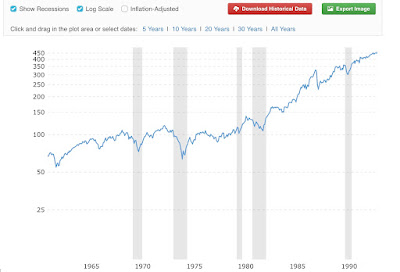
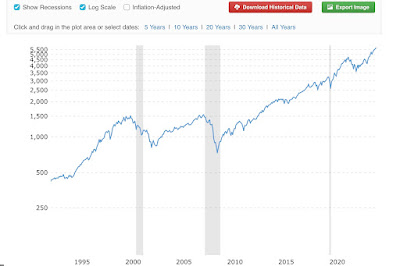
Here is the (almost) 100 year graph of the S&P 500 showing that, broken down into three 30+ year increments:
Outside of 1929, the market has always peaked at least 2 months before a recession has begun (those occasions were 1990 and 2007), and usually well before that.
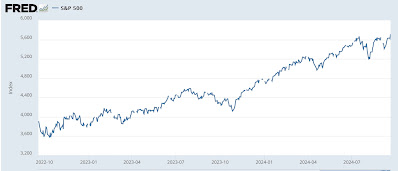
Which of course makes it noteworthy that the S&P 500 made a new all time high yesterday:
Not only does that make it a virtual certainty that we’re not in a recession now, contra some DOOOMers, but it is very unlikely for one to start in the next few months.
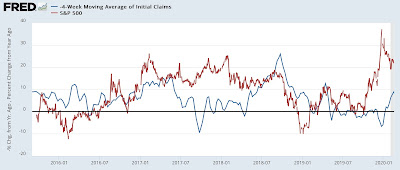
Another way to look at that is to update my “quick and dirty” economic indicator of the YoY% change in stocks and the inverted YoY% change in initial jobless claims. Here’s what that looked like in the five years before the pandemic, showing that stock prices were lower YoY several times with no recession occurring (showing how they are over-sensitive to the downside):
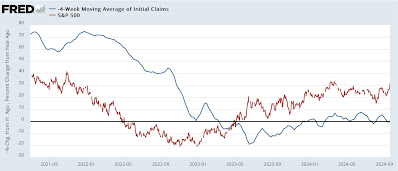
And here is what they look like up through yesterday:
Typically coincident with or near to the onset of a recession, the market is down YoY, and initial claims are higher by 10% or more. Needless to say, neither of those is even remotely the case at present.
There are some caution signals out there, as I have highlighted earlier this week (real retail sales, housing units under construction), but lots that is flashing green and nothing significant that is flashing red.
The Bonddad Blog
Housing sector enters yellow flag “recession watch” territory, Angry Bear by New Deal democrat

