– by New Deal democrat Initial jobless claims will be up against some very challenging comparisons for the next 6 months or so, due to some unresolved post-COVID seasonality. Which means that the headline numbers this week, which look very benign at the surface, are not quite so good as they have been for the past year. For the week, initial claims rose 6,000 to 225,000. The four week moving average declined -750 to 224,250. Continuing claims, with the typical one week lag, declined -1,000 to 1.826 million: Again, as you can see from the above, all of these look pretty benign in absolute terms. But for forecasting purposes, the YoY% change is more important, and viewed that way, the story is a little different. Initial claims were up
Topics:
NewDealdemocrat considers the following as important: 2024, jobless claims, US EConomics
This could be interesting, too:
NewDealdemocrat writes JOLTS revisions from Yesterday’s Report
Bill Haskell writes The North American Automobile Industry Waits for Trump and the Gov. to Act
Bill Haskell writes Families Struggle Paying for Child Care While Working
Joel Eissenberg writes Time for Senate Dems to stand up against Trump/Musk
– by New Deal democrat
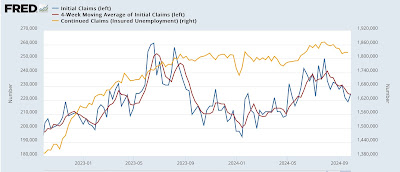
Initial jobless claims will be up against some very challenging comparisons for the next 6 months or so, due to some unresolved post-COVID seasonality. Which means that the headline numbers this week, which look very benign at the surface, are not quite so good as they have been for the past year.
For the week, initial claims rose 6,000 to 225,000. The four week moving average declined -750 to 224,250. Continuing claims, with the typical one week lag, declined -1,000 to 1.826 million:
Again, as you can see from the above, all of these look pretty benign in absolute terms.
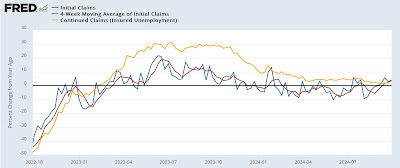
But for forecasting purposes, the YoY% change is more important, and viewed that way, the story is a little different. Initial claims were up 4.2%, the four week average up 3.6%, and continuing claims up 2.1%:
With the exception of a couple of weeks in January, both initial claims comparisons are the worst since last October. Continuing claims has trended slightly higher since their low YoY point several weeks ago.
This does *not* mean recession. For even a yellow caution flag, these would need to be higher YoY by 10%. But initial claims are no longer positive for the economy either. Rather they suggest an economy slowing to so-so expansion.
Finally, let’s take our last look at what claims suggest about the unemployment rate tomorrow and for the next few months.
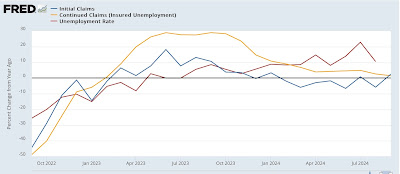
First, here is the YoY% change look:
After trending higher one year ago, earlier this year both initial and continuing claims hewed close to unchanged for most of this year. The unemployment rate, which has been heavily affected by new (immigrant) entrants to the labor force, has not followed – a very rare event over the past 60 years.
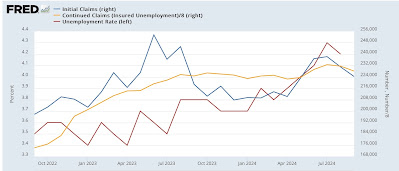
Here is the absolute level view:
Based on historical experience, the unemployment rate should have trended down, towards 3.7%, not up, during this summer. Even with the effect of a sharp increase in the labor force, initial and continuing claims suggest that the unemployment rate will not tick higher, but remain at 4.2% +/-0.1%. We’ll see tomorrow.
The Bonddad Blog
Weekly jobless claims: good news and ‘meh’ news, Angry Bear by New Deal democrat


