– by New Deal democrat First things first: there’s almost no significant economic news at all this week until Thursday, so don’t be surprised if I play hooky for a day or two. The coincident headline news out of last Friday’s employment report was very positive, so most all observers heaved a sigh of relief. Of course, precisely *because* it is coincident, it could all be reversed next month, or by next month’s revisions to Friday’s data. But since I am all about leading indicators and forecasting, let’s take a deeper look at those indicators from Friday’s report. First, a little perspective. Recall that last week I was writing about manufacturing and construction. The former has been showing at least mild contraction for many months
Topics:
NewDealdemocrat considers the following as important: Employment, US EConomics
This could be interesting, too:
NewDealdemocrat writes JOLTS revisions from Yesterday’s Report
Bill Haskell writes The North American Automobile Industry Waits for Trump and the Gov. to Act
Bill Haskell writes Families Struggle Paying for Child Care While Working
Joel Eissenberg writes Time for Senate Dems to stand up against Trump/Musk
– by New Deal democrat
First things first: there’s almost no significant economic news at all this week until Thursday, so don’t be surprised if I play hooky for a day or two.
The coincident headline news out of last Friday’s employment report was very positive, so most all observers heaved a sigh of relief. Of course, precisely *because* it is coincident, it could all be reversed next month, or by next month’s revisions to Friday’s data.
But since I am all about leading indicators and forecasting, let’s take a deeper look at those indicators from Friday’s report.
First, a little perspective. Recall that last week I was writing about manufacturing and construction. The former has been showing at least mild contraction for many months according to most measures, while the latter has continued to grow. I pointed out that for an economic downturn, I’d be looking for both to contract in tandem. The service sector for many decades has tended to expand in all but the deepest recessions. So it’s only when the goods sector as a whole turns down that there is enough downward pressure to pull the economy generally down with it. Which is why, when we had the very good ISM services report on Thursday, which showed that the economically weighted average of manufacturing and non-manufacturing remained expansionary, I was relieved.
So, with that background let’s look at the manufacturing, construction, and other leading indicators from the jobs report.
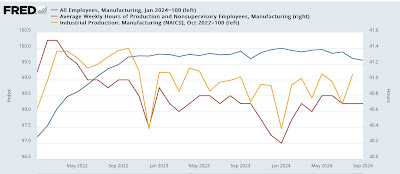
Turning to manufacturing first, here are all employees in the sector (blue, left scale, normed to 100 as of their recent peak) vs. the average manufacturing workweek (red, right scale), and manufacturing production (gold, left scale, also normed to 100 as of their recent peak) from the industrial production report:
Manufacturing hours have been part of the official Index of Leading Indicators for many decades. That’s because factories cut back hours before they actually lay off employees, so they are the proverbial “canary in the coal mine.” Hours declined sharply in 2022, but have stabilized in the past 18 months except for a downturn last Holiday season.
Production peaked later in 2022, but has also stabilized in the past 18 months. The number of manufacturing sector employees, meanwhile, continued to very gradually increase until peaking this past January. It has declined -0.4% since.
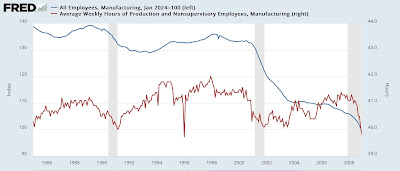
A historical look shows that while this is consistent with weakness, it is not recessionary:
Manufacturing employment in the past 40 years has typically declined by -5.0% or more before a recession has begun, and hours have declined sharply below an average of 40.5 per week. This year hours have stabilized at about 40.7.
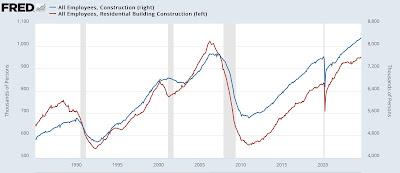
Turning to construction, both total jobs in that sector and the even more leading housing construction jobs continued to increase to new post-pandemic highs in Friday’s report. In the case of the latter, it was also a 15+ year high; for the latter it was also an all-time high:
Note that housing construction jobs have always turned down first, and many months before the last three recessions before the pandemic. Total construction jobs also peaked before two of the three pre-pandemic recessions, although somewhat later.
Needless to say, this is very positive.
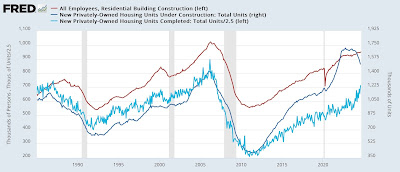
As I wrote last week, housing construction employment (red) tends to peak after housing units under construction (dark blue, right scale) does, sometimes by many, many months. It also has only peaked after housing units actually completed (light blue, left, /2.5 for scale) has peaked as well:
While the sharp decline in housing units under construction in the past few months remains a considerable concern, housing units completed has continued to increase, just as sharply. So, it appears we have at least a few more months to go before residential building employment might turn down.
Several of the other leading indicators in employment are not faring so well.
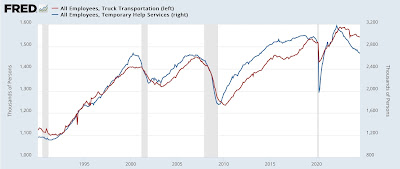
Temporary help was an excellent leading indicator before each of the last three pre-pandemic recessions. Post-pandemic it peaked in early 2022 and has been declining sharply for 2.5 years ever since. Trucking employment, meanwhile, flattened out and sometimes declined before the previous recessions. It has also been declining for two years (the sharp decline one year ago was caused by the bankruptcy of one major trucking firm):
I suspect there are unique factors having to do with the severe “overshoot” in temporary employment right after the pandemic, and employers’ hoarding existing help thereafter, which make this series unreliable this time around (remember, no indicator is perfect!). Trucking is of somewhat more concern and seems to mirror the downturn in manufacturing production we saw in the first graph above.
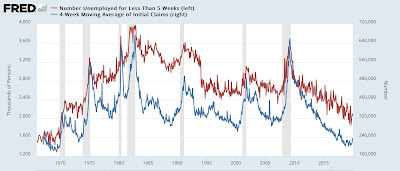
Another such indicator is short term unemployment (less than 5 weeks). This series is similar to, but predated the tabulation of initial jobless claims by several decades. Its drawback is that it is much noisier, meaning there are many more false positives or false negatives, as shown in the historical graph below:
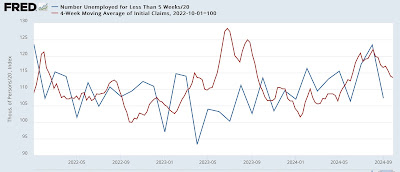
Here’s the post-pandemic view, with each series normed to 100 as of their lowest levels (in the case of unemployment, the lowest three-month average):
As you can see, the four-week average of initial jobless claims gives a much cleaner and less noisy signal, although as I point out weekly, there appears to be some residual post-pandemic seasonality.
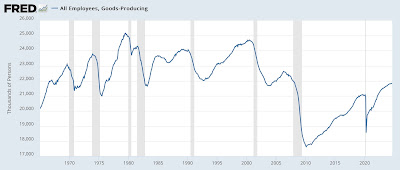
Finally, let’s look at goods employment as a whole. The long-term historical look shows that, with the exception of 1974 (the first oil shock) and 1982 (caused by quick sharp Fed rate hikes), goods employment has always peaked at least several months before a recession:
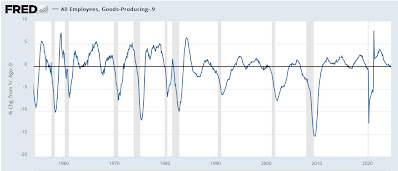
Goods employment also continued to increase to a new post-pandemic high last month, although the gains are decelerating, currently to +0.9% YoY. So, let’s look at the YoY% situation, and subtract -0.9%, so that the current level shows at the zero line:
Before the 1980s, a sharp decline to this level of YoY growth almost always meant an imminent recession. But in the past 40 years since the early 1980s, this has been consistent with at least weak economic growth, and for much of the period it has been average.
To sum up, there are some legitimate areas of concern in the leading indicators from the jobs report, mainly trucking and short-term unemployment. There are several other weakly negative or neutral leading indicators: manufacturing employment and hours. But the main tone remains positive, if weakly so, mainly due to the continued strength in the construction sector, which is boosting goods production employment as a whole.
So long as construction employment, and in particular residential construction employment, holds up, the economy will remain in decent shape.
The Bonddad Blog
Leading Indicators from Friday’s jobs report, Angry Bear by New Deal democrat
Leading indicators in the Q1 GDP report are mixed, Angry Bear by New Deal democrat

