By New Deal democrat Wages and household income vs. housing: which leads which? Sometimes I look into a relationship that doesn’t quite pan out, but it’s still useful to flesh out the process. That’s the story of real wage growth vs. housing. In the last few months I ‘ve pointed out that real wage growth has been slowing. In January, it went negative YoY. Since, all else being equal, having less money to save for a downpayment, or to pay the montly mortgage ought to lead to fewer new housees being built, So has that been the case historically? Well, first of all, here are real wages (blue, left scale) vs. housing permits (red, right scale): It’s hard to see any consistent relationship. If anything, it might be that housing permits turn before real wages. So let’s look at the YoY relationship, below: Since the series started in the 1960s through the mid 1980s, permits appear to have led real wages. But since the mid-1980s, the relationship if any is less clear, with coincident turns until 2001, and then if anything wages appearing to lead permits. But a better measure might be real median household income, since as we know women entered the workforce in large numbers in the 1970s through the 1990s.
Topics:
Dan Crawford considers the following as important: US/Global Economics
This could be interesting, too:
Joel Eissenberg writes How Tesla makes money
Angry Bear writes True pricing: effects on competition
Angry Bear writes The paradox of economic competition
Angry Bear writes USMAC Exempts Certain Items Coming out of Mexico and Canada
by New Deal democrat
Wages and household income vs. housing: which leads which?
Sometimes I look into a relationship that doesn’t quite pan out, but it’s still useful to flesh out the process. That’s the story of real wage growth vs. housing.
In the last few months I ‘ve pointed out that real wage growth has been slowing. In January, it went negative YoY. Since, all else being equal, having less money to save for a downpayment, or to pay the montly mortgage ought to lead to fewer new housees being built, So has that been the case historically?
Well, first of all, here are real wages (blue, left scale) vs. housing permits (red, right scale):
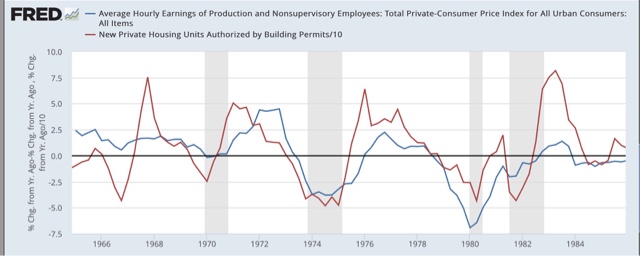
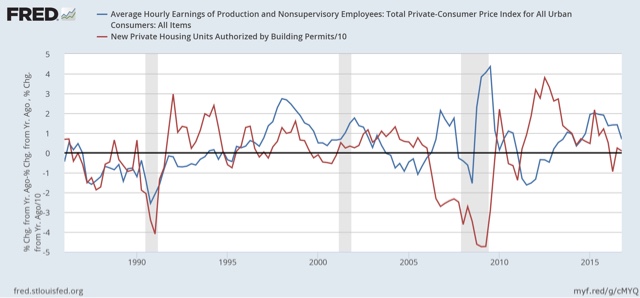
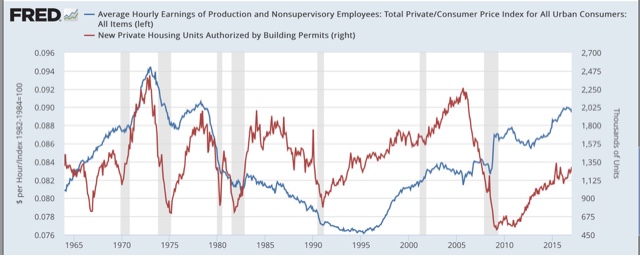 It’s hard to see any consistent relationship. If anything, it might be that housing permits turn before real wages. So let’s look at the YoY relationship, below:
Since the series started in the 1960s through the mid 1980s, permits appear to have led real wages.
But since the mid-1980s, the relationship if any is less clear, with coincident turns until 2001, and then if anything wages appearing to lead permits.
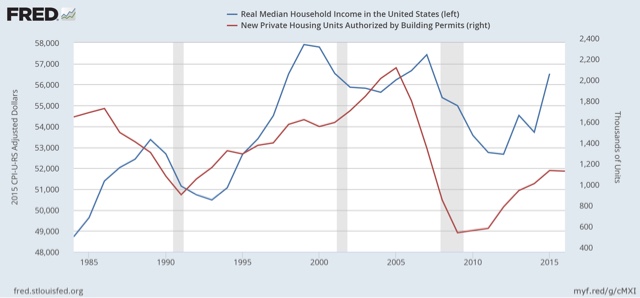
But a better measure might be real median household income, since as we know women entered the workforce in large numbers in the 1970s through the 1990s. Since household income is only measured annually, I’ve used that unit of comparison below:
Again, if anything, permits seem to lead household income by about 2 years.
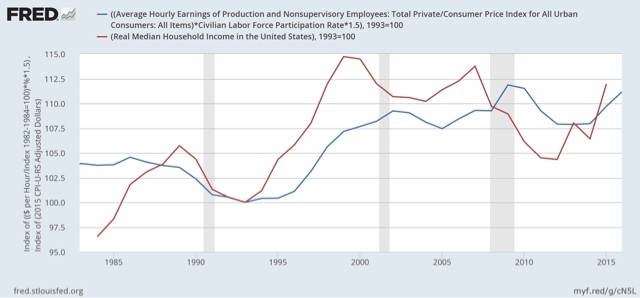
Finally, it occured to me that normalizing for labor force participatioin might give me a more granular look. So below is a comparison of median household income (red) vs. real wages normalized by labor force participation, both series set to a value of 100 in 1993:
The 1980s do not appear to correlate at all. Since 1990, there is a broad correaltion, but with income ahead of wages by a year or two.
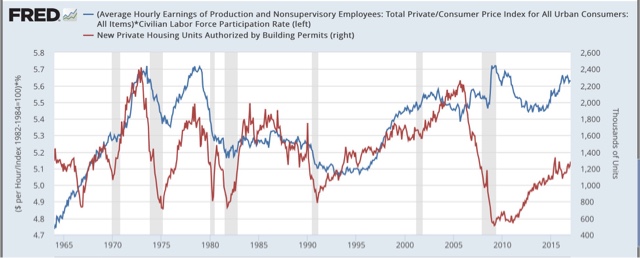
Just to fl esh this out, let’s take a look at wages adjusted by labor force participation vs. housing:
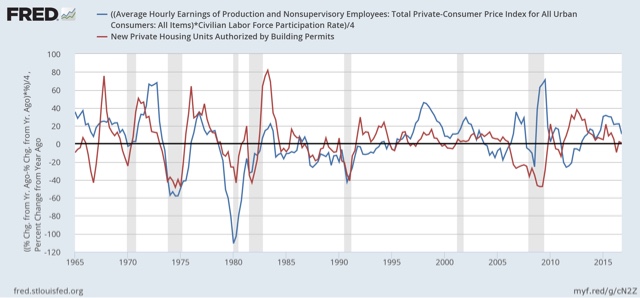
Here is the same relatinship YoY:
This at last does seem to give us a reasonably consistent relationship whereby the YoY change in real wages adjusted by partication either are coincident with or slightly lag housing, with the exception of ths housing bubble and bust. If this is true, then we should expect the recent slowdown in YoY growth in the housing market to give rise to a stagnation at least of participation as well as real wage growth.

