Saturday , November 23 2024
Home / The Angry Bear / Two thoughts on the Virginia election: it’s the net strong disapproval,stupid! But is the primary driver education or age?

Two thoughts on the Virginia election: it’s the net strong disapproval,stupid! But is the primary driver education or age?

Summary:
Two thoughts on the Virginia election: it’s the net strong disapproval,stupid! But is the primary driver education or age? It’s a slow week for economic news, but we sure had some electoral fireworks on Tuesday! Since I am a data nerd, here are two metrics from Virginia that caught my attention, which I’ll discuss in reverse order. I. Is it education or is it age? Here are two graphs showing how the elections broke down: First, by racial makeup of the legislative district (horizontal axis) vs. percent with college degree (vertical axis): Republicans were completely shut out in districts with less than 50% white populations. With one exception, they were also shut out in majority white districts with more than 50% holding college degrees.  On the

Topics:
NewDealdemocrat considers the following as important: ,

This could be interesting, too:

Peter Radford writes Election: Take Four

Bill Haskell writes Healthcare Insurance in the United States

Joel Eissenberg writes Seafood says global warming is not a hoax

Bill Haskell writes The Opioid Epidemic from 1980 Onward in My Words

Two thoughts on the Virginia election: it’s the net strong disapproval,stupid! But is the primary driver education or age?

It’s a slow week for economic news, but we sure had some electoral fireworks on Tuesday! Since I am a data nerd, here are two metrics from Virginia that caught my attention, which I’ll discuss in reverse order.
I. Is it education or is it age?
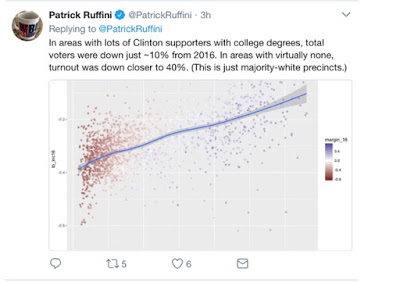
Here are two graphs showing how the elections broke down:
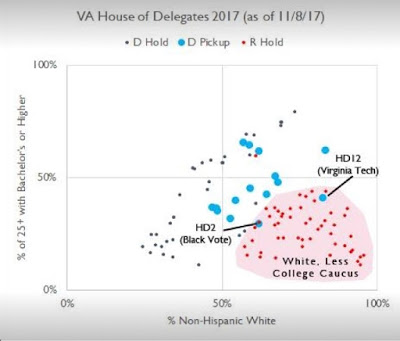
First, by racial makeup of the legislative district (horizontal axis) vs. percent with college degree (vertical axis):
Two thoughts on the Virginia election: it’s the net strong disapproval,stupid! But is the primary driver education or age?
Republicans were completely shut out in districts with less than 50% white populations. With one exception, they were also shut out in majority white districts with more than 50% holding college degrees.  On the contrary, the GOP won all but two districts with more than about 55%-60% white population where *also* less than 40%-45% hold college degrees.

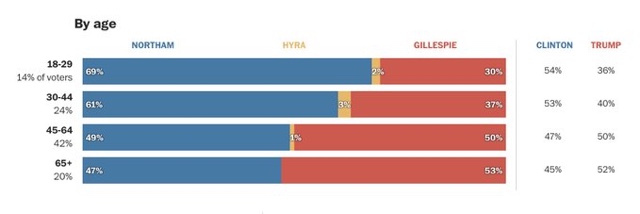
Now let’s look at the vote by age:
Two thoughts on the Virginia election: it’s the net strong disapproval,stupid! But is the primary driver education or age?

Senior citizens voted for Gillespie. Middle-aged adults split almost evenly between the two candidates.

The younger than 45 you got, the bigger the share for Northam.

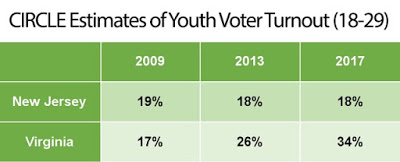
Now let’s look at turnout. Turnout was higher than in the previous elections both by younger people:

Two thoughts on the Virginia election: it’s the net strong disapproval,stupid! But is the primary driver education or age?
and by the college educated:
Two thoughts on the Virginia election: it’s the net strong disapproval,stupid! But is the primary driver education or age?
It’s pretty clear that there are strong red-blue divides along the axes of age and education.
But which is more significant? For example, is a senior citizen with a college degree more or less likely to have voted Democratic vs. a Millennial without a college degree? The issue is confounded because the percent of those with college educations increased from the post-WW2 era into the 1980s at least:
Two thoughts on the Virginia election: it’s the net strong disapproval,stupid! But is the primary driver education or age?
Not only have I not seen this issue addressed for the Virginia vote earlier this week, I still haven’t seen it addressed for last year’s Presidential election! This has serious electoral implications.  If the primary driver is age (as in, those who formed their political opinions before the Civil and Voting Rights Acts of 1964 and 1965 were passed), well then (ahem) mortality will take care of the issue.  If it’s education, the critical divide is going to persist, albeit with less intensity.
My guess is that education is the stronger driver, a point brought home by one of the Trump supporters in Johnstown, PA, re-interviewed by Michael Kruse recently, who lamented that all of the young people with prospects had moved away (probably to a growing metropolis where they were voting Democratic). But I’d like to see the data!
2. It’s the net strong disapproval, stupid!
Regardless of the answer to the first question, there is one metric that forecast the outcome of the Virginia election very well: net strong disapproval minus strong approval.
Three months ago, I wrote about this metric, indicating I thought it was a good way to look at midterm elections:

I like K.I.S.S. methods, and I have decided that the easiest K.I.S.S. guide to the midterm elections is likely to be Rasmussen’s “net strong disapproval” spread.  The theory is that while voters who even weakly approve or disapprove of a President are likely to come out and vote in the Presidential election years, only those with strong opinion — a substantially smaller number — come out to vote in midterm elections.

….

[O]n Election Days 2010 and 2014, for every 100 adults who strongly disapproved of Obama, there were only 60-65 and 55 adults who strongly approved of his performance — enough for a GOP wave in each case.

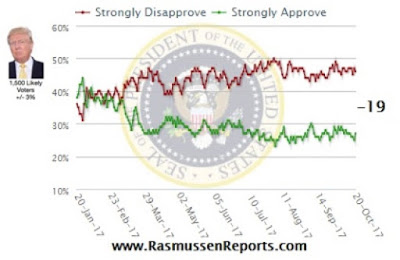
In August, I noted that the same metric for Trump had fallen to similar levels.  It has remained fairly stable since:

Two thoughts on the Virginia election: it’s the net strong disapproval,stupid! But is the primary driver education or age?
There is one important difference, though. At its worst, strong disapproval for Obama was only about 40%, with strong approval languishing just under 20%. For Trump, both numbers are about 10% higher — he has both bigger strong disapproval  (45%-50%), and bigger strong approval (23%-29%).
If strong opinions drive off-year turnout, then we should expect to see bigger turnout for both the party in national power as well as the party out of power.
And that’s exactly what happened in Virginia.  For example, here’s Larry Sabato:

 [T]his was an intensity surge for Democrats more than it was a falloff for Republicans: while it’s not exactly an apples-to-apples comparison because there was a bigger third party vote in 2013, Gillespie got about 160,000 more votes than Cuccinelli did four years ago. But Northam got 335,000 more votes than outgoing Gov. Terry McAuliffe (D).

Turnout increased for *both* GOP and Democratic voters, but comparatively the turnout was much, much higher on the Democratic side.

This gives me confidence that I am on the right track using this metric to forecast the midterms. In other words, if one year from now strong disapproval vs. strong approval is about where it is now, almost every GOP officeholder in a jurisdiction or district that was carried by Hillary Clinton in 2016 is Doomed.

Of course, approval vs. disapproval numbers can and do change with time and events. But it seems very unlikely that Trump is going to be less polarizing a figure one year from now than he has been for the last two years.  Which means that either war and/or changes in the economy are the likely determinants of meaningful changes in net strong disapproval between now and then.

I have no clue what might transpire on the international scene, but forecasting the economy one year out is right in my wheelhouse.  I’ll address that shortly.

Leave a Reply

Your email address will not be published. Required fields are marked *