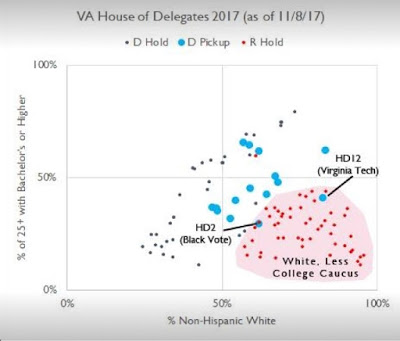
Two thoughts on the Virginia election: it’s the net strong disapproval,stupid! But is the primary driver education or age? It’s a slow week for economic news, but we sure had some electoral fireworks on Tuesday! Since I am a data nerd, here are two metrics from Virginia that caught my attention, which I’ll discuss in reverse order. I. Is it education or is it age? Here are two graphs showing how the elections broke down: First, by racial makeup of the legislative district (horizontal axis) vs. percent with college degree (vertical axis): Republicans were completely shut out in districts with less than 50% white populations. With one exception, they were also shut out in majority white districts with more than 50% holding college degrees. On the
Topics:
NewDealdemocrat considers the following as important: politics, Taxes/regulation
This could be interesting, too:
Robert Skidelsky writes Lord Skidelsky to ask His Majesty’s Government what is their policy with regard to the Ukraine war following the new policy of the government of the United States of America.
Joel Eissenberg writes No Invading Allies Act
Ken Melvin writes A Developed Taste
Bill Haskell writes The North American Automobile Industry Waits for Trump and the Gov. to Act
Two thoughts on the Virginia election: it’s the net strong disapproval,stupid! But is the primary driver education or age?
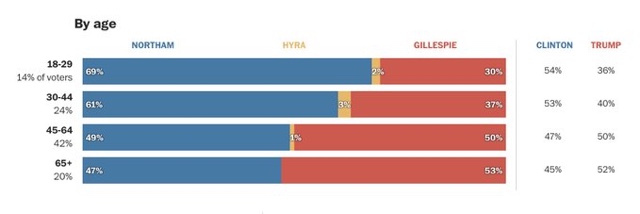
Senior citizens voted for Gillespie. Middle-aged adults split almost evenly between the two candidates.
The younger than 45 you got, the bigger the share for Northam.
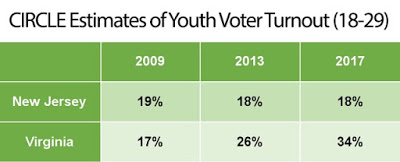
Now let’s look at turnout. Turnout was higher than in the previous elections both by younger people:
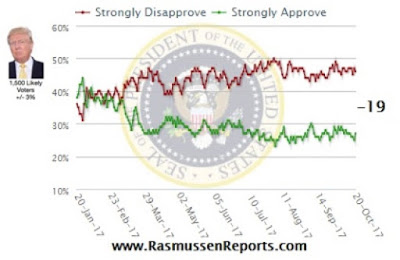
I like K.I.S.S. methods, and I have decided that the easiest K.I.S.S. guide to the midterm elections is likely to be Rasmussen’s “net strong disapproval” spread. The theory is that while voters who even weakly approve or disapprove of a President are likely to come out and vote in the Presidential election years, only those with strong opinion — a substantially smaller number — come out to vote in midterm elections.
….
[O]n Election Days 2010 and 2014, for every 100 adults who strongly disapproved of Obama, there were only 60-65 and 55 adults who strongly approved of his performance — enough for a GOP wave in each case.
In August, I noted that the same metric for Trump had fallen to similar levels. It has remained fairly stable since:
[T]his was an intensity surge for Democrats more than it was a falloff for Republicans: while it’s not exactly an apples-to-apples comparison because there was a bigger third party vote in 2013, Gillespie got about 160,000 more votes than Cuccinelli did four years ago. But Northam got 335,000 more votes than outgoing Gov. Terry McAuliffe (D).
This gives me confidence that I am on the right track using this metric to forecast the midterms. In other words, if one year from now strong disapproval vs. strong approval is about where it is now, almost every GOP officeholder in a jurisdiction or district that was carried by Hillary Clinton in 2016 is Doomed.
Of course, approval vs. disapproval numbers can and do change with time and events. But it seems very unlikely that Trump is going to be less polarizing a figure one year from now than he has been for the last two years. Which means that either war and/or changes in the economy are the likely determinants of meaningful changes in net strong disapproval between now and then.

