Along with most indicators, this one turned south as oil capex collapsed: Update: Framing Lumber Prices down Sharply Year-over-year Here is another graph on framing lumber prices. Early in 2013 lumber prices came close to the housing bubble highs.The price increases in early 2013 were due to a surge in demand (more housing starts) and supply constraints (framing lumber suppliers were working to bring more capacity online).Prices didn’t increase as much early in 2014 (more supply, smaller “surge” in demand).In 2015, even with the pickup in U.S. housing starts, prices are down year-over-year. Note: Multifamily starts do not use as much lumber as single family starts, and there was a surge in multi-family starts. There were hopes that the last tic up was the beginning of a reversal but now seems the downtrend since the oil capex collapse may still be in progress:The deflationary forces continue: Import and Export Prices No sign of consumer strength here:Inventories remain high going into Q4: Wholesale TradeHighlightsWholesale inventories rose 0.5 percent in September following an upward revised 0.3 percent gain in August. The September build appears to be intentional based on a 0.5 percent rise in September sales that keeps the stock-to-sales ratio for wholesalers unchanged at 1.31.Inventories of autos rose 2.
Topics:
WARREN MOSLER considers the following as important: housing, inflation, trade
This could be interesting, too:
Nick Falvo writes Subsidized housing for francophone seniors in minority situations
Matias Vernengo writes Serrano, Summa and Marins on Inflation, and Monetary Policy
Angry Bear writes Voters Blame Biden and Harris for Inflation
NewDealdemocrat writes Declining Housing Construction
Along with most indicators, this one turned south as oil capex collapsed:
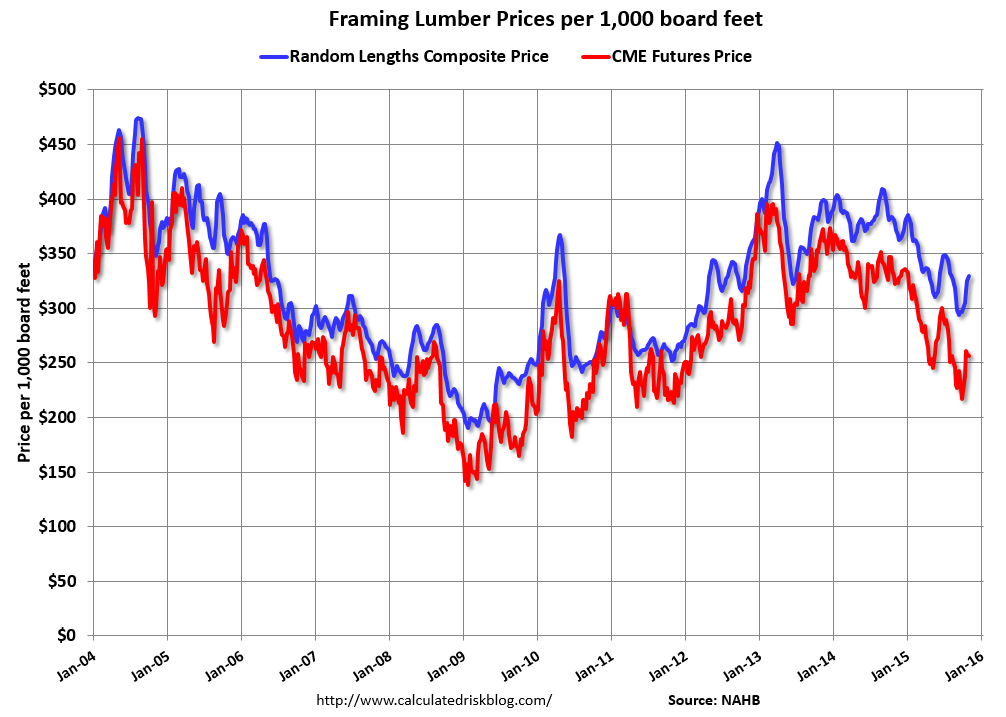
Update: Framing Lumber Prices down Sharply Year-over-year
Here is another graph on framing lumber prices. Early in 2013 lumber prices came close to the housing bubble highs.
The price increases in early 2013 were due to a surge in demand (more housing starts) and supply constraints (framing lumber suppliers were working to bring more capacity online).
Prices didn’t increase as much early in 2014 (more supply, smaller “surge” in demand).
In 2015, even with the pickup in U.S. housing starts, prices are down year-over-year. Note: Multifamily starts do not use as much lumber as single family starts, and there was a surge in multi-family starts.
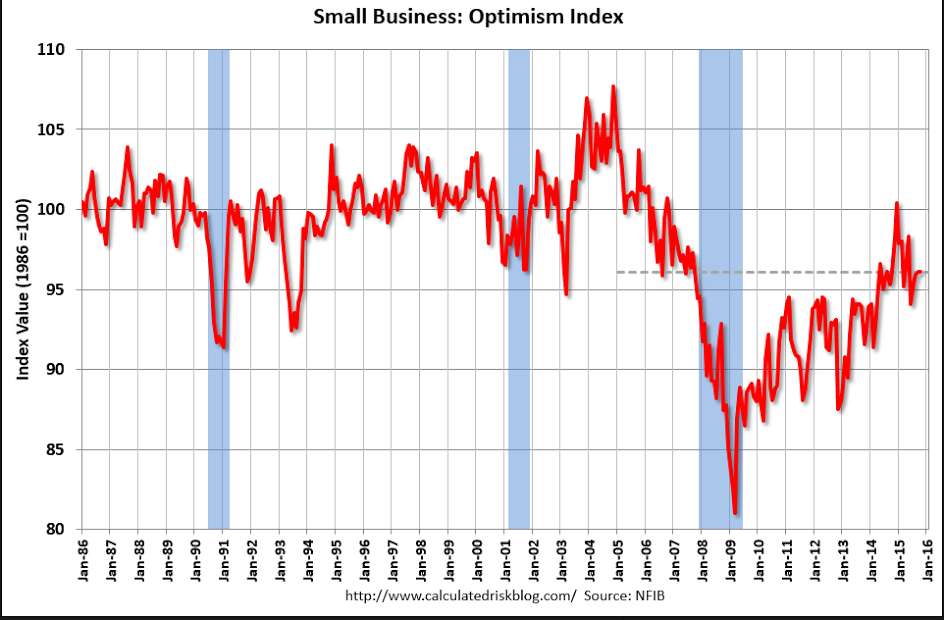
There were hopes that the last tic up was the beginning of a reversal but now seems the downtrend since the oil capex collapse may still be in progress: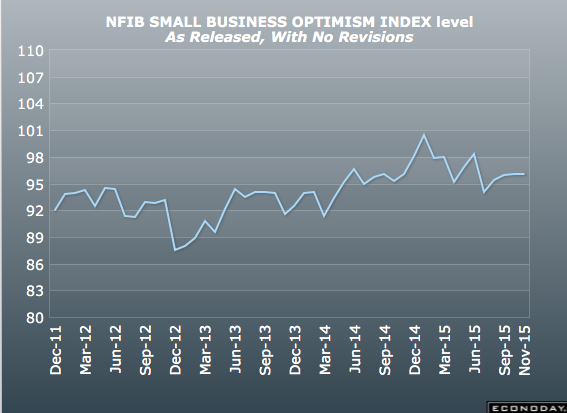
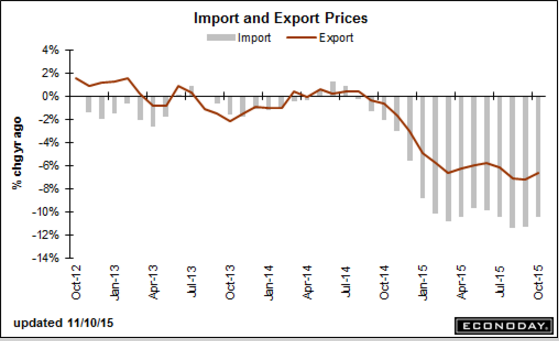
The deflationary forces continue:
No sign of consumer strength here: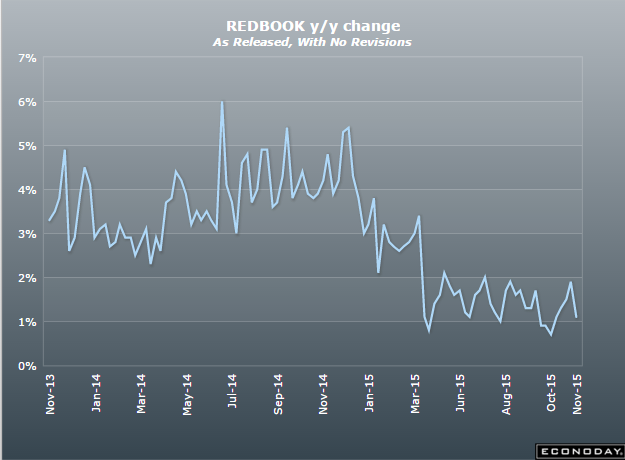
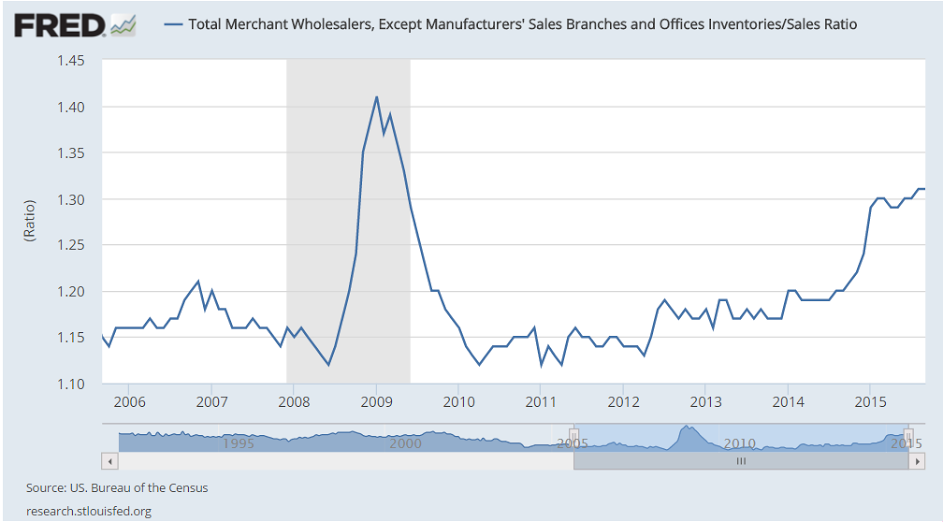
Inventories remain high going into Q4:
Wholesale Trade
Highlights
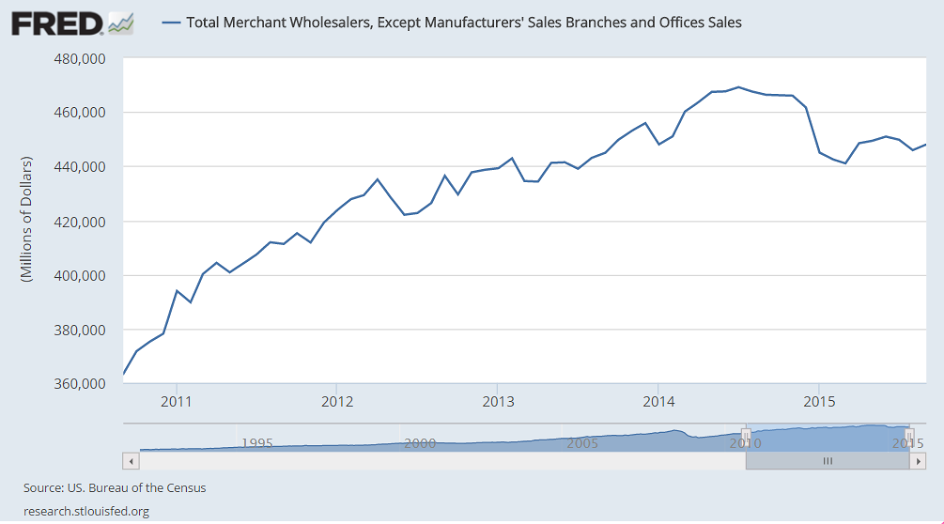
Wholesale inventories rose 0.5 percent in September following an upward revised 0.3 percent gain in August. The September build appears to be intentional based on a 0.5 percent rise in September sales that keeps the stock-to-sales ratio for wholesalers unchanged at 1.31.Inventories of autos rose 2.3 percent as wholesalers try to keep up with what is very strong retail demand for autos. Excluding autos, the stock-to-sales wholesale ratio is unchanged at 1.27.
Inventory draws reflecting gains in sales include computer equipment, electrical goods, and apparel. Wholesale inventories of furniture rose on a swing lower for sales.
Inventories in general are heavy and businesses, waiting for a pick up in sales, are being careful to keep them in check. Today’s results are in line with Commerce Department assumptions and should have little bearing on third-quarter GDP revisions. Watch Friday for the business inventories report which will include data from the retail sector.
Sales looking like recession: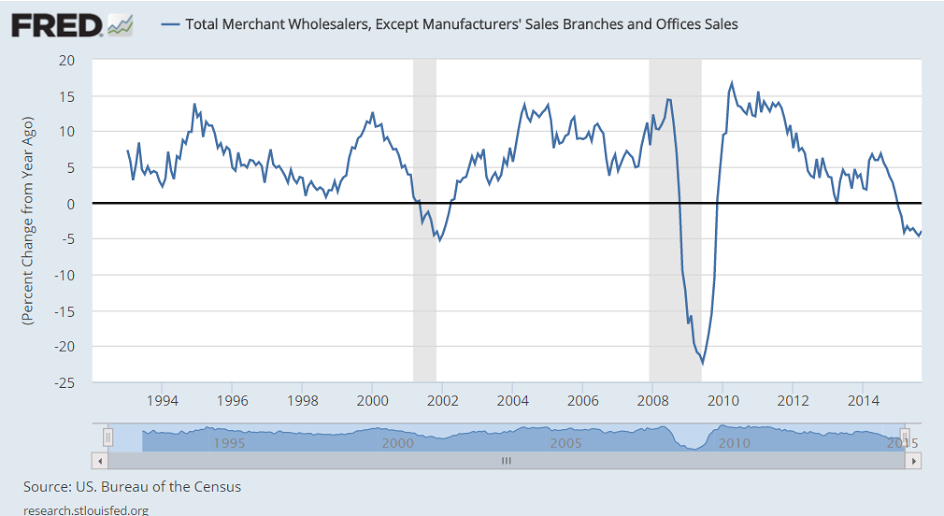
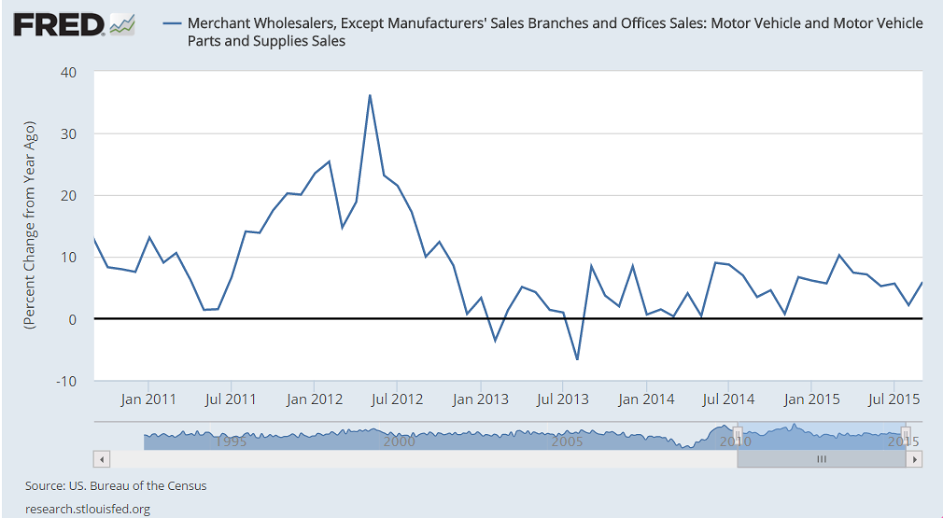
Autos are just holding their own: