February 2018 JOLTS report: positive trend revised away Last month I wrote that the January JOLTS report reflected very positive trends. Today they got revised away. As a refresher, unlike the jobs report, which tabulates the net gain or loss of hiring over firing, the JOLTS report breaks the labor market down into openings, hirings, firings, quits, and total separations. I pay little attention to “job openings,” which can simply reflect that companies trolling for resumes, or looking for the perfect, cheap candidate, and concentrate on the hard data of hiring, firing, quits and layoffs. The first important relationship in the data is that historically, hiring leads firing. While the one big shortcoming of this report is that it has only covered one
Topics:
NewDealdemocrat considers the following as important: US/Global Economics
This could be interesting, too:
Joel Eissenberg writes How Tesla makes money
Angry Bear writes True pricing: effects on competition
Angry Bear writes The paradox of economic competition
Angry Bear writes USMAC Exempts Certain Items Coming out of Mexico and Canada
February 2018 JOLTS report: positive trend revised away
Last month I wrote that the January JOLTS report reflected very positive trends. Today they got revised away.
As a refresher, unlike the jobs report, which tabulates the net gain or loss of hiring over firing, the JOLTS report breaks the labor market down into openings, hirings, firings, quits, and total separations.
I pay little attention to “job openings,” which can simply reflect that companies trolling for resumes, or looking for the perfect, cheap candidate, and concentrate on the hard data of hiring, firing, quits and layoffs.
The first important relationship in the data is that historically, hiring leads firing. While the one big shortcoming of this report is that it has only covered one full business cycle, during that time hires have peaked and troughed before separations.
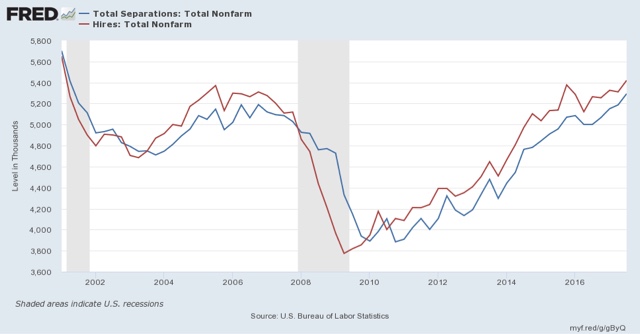
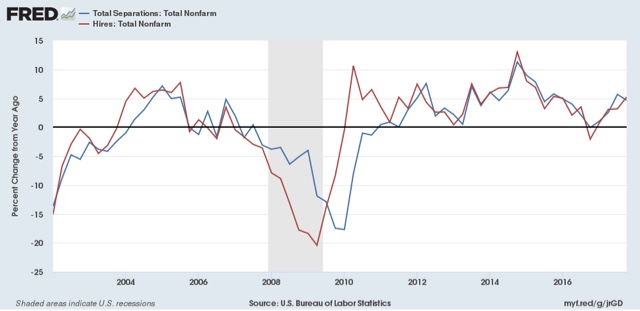
And here, there has been an important revision. Here is the historical relationship on a quarterly basis between hiring (red) and total separations (blue) as it existed through the end of the third quarter of 2017:
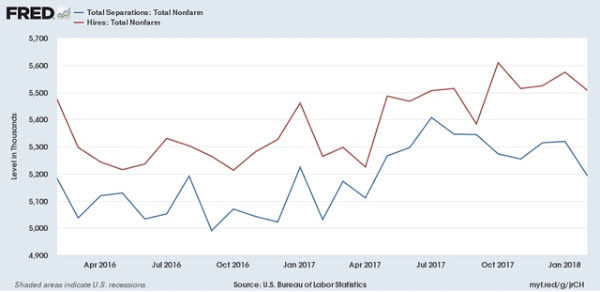
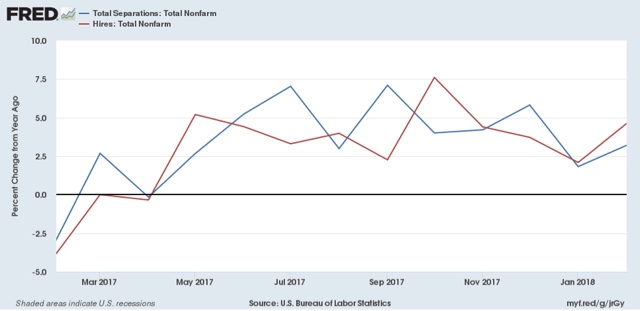
The updated graph shows hiring exceeding its prior peak in the second halfof 2017 with its last monthly peak in October. Significantly, hiring for the previous month was revised downward below this peak.
Meanwhile separations actually peaked before then, in July of last year, with a clear downtrend since, another significant revision since last month. *if* both have made their expansion highs, needless to say that would be important.
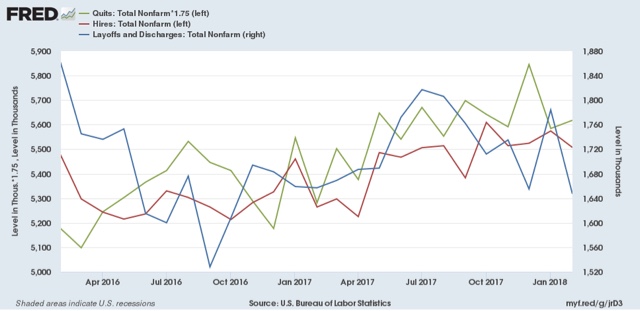
[Note: above graph show quarterly data to smooth out noise]Here are voluntary quits vs. layoffs and discharges on a monthly basis for the last 2 years:
If we have established the expansion peaks in hiring and total separations, I would expect quits to continue to improve for a short while (as they have) before also beginning to decline. As in the last expansion, separations appear to have bottomed.
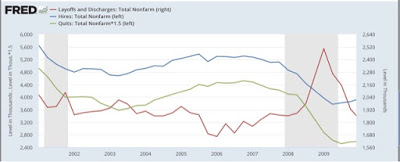
This month’s report acts as a caution about revisions, most importantly by the downward revision in hiring and separations. Last month the trend appeared clearly positive for both, but as revised it is more questionable as to hires, and looks negative as to separations. That being said, I don’t even see a yellow flag until hires and separations go negative YoY, as they did before well before the last recession (quarterly through Q4 2017 in the graph below):
They haven’t yet:
If three months from now we haven’t established any new highs in hires and total separations, and they are hovering at or below zero YoY, then we can talk about a late-cycle trend.

