- by New Deal democrat Gas prices and likely January inflation to continue the stall in real wage growth A big relatively unnoticed concern over the last year has been the end of deflation due to the end of the decline in gas prices. Coupled with really tepid wage growth, this is going to affect consumers, who are 70% of the US economy. Gas prices aren’t a headwind yet. They have increased about 25% YoY. In the past, it has taken a 40% or more spike YoY to create real downward pressure on the economy: Now that January is over, I can estimate the inflation rate based on the increase in gas prices. I take the percentage increase for gas, divide it by between 10 and 16 to account for its volatility, and that gives me the non-seasonally adjusted monthly inflation rate. In the graph below, covering the last 12 months, the % change in gas prices is the blue bar, the NSA inflation rate is the red bar, and the seasonally adjusted inflation rate is the green bar: In January 2016, gas prices declined by about 4%, whereas this year they increased by about 3%. This tells me that the NSA change in consumer prices should be about +0.3%, and the SA change about +0.1%. That will bring the YoY change in the inflation rate to 2.3%. Since nominal nonsupervisory wages are up 2.
Topics:
Dan Crawford considers the following as important: Uncategorized
This could be interesting, too:
tom writes The Ukraine war and Europe’s deepening march of folly
Stavros Mavroudeas writes CfP of Marxist Macroeconomic Modelling workgroup – 18th WAPE Forum, Istanbul August 6-8, 2025
Lars Pålsson Syll writes The pretence-of-knowledge syndrome
Dean Baker writes Crypto and Donald Trump’s strategic baseball card reserve
- by New Deal democrat
Gas prices and likely January inflation to continue the stall in real wage growth
A big relatively unnoticed concern over the last year has been the end of deflation due to the end of the decline in gas prices. Coupled with really tepid wage growth, this is going to affect consumers, who are 70% of the US economy.
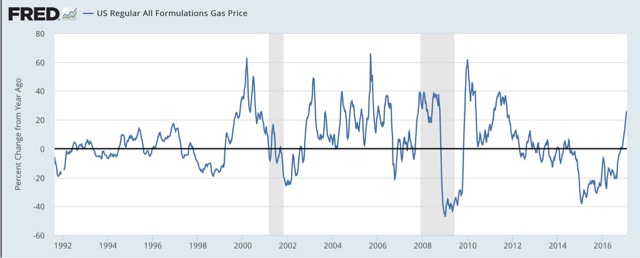
Gas prices aren’t a headwind yet. They have increased about 25% YoY. In the past, it has taken a 40% or more spike YoY to create real downward pressure on the economy:
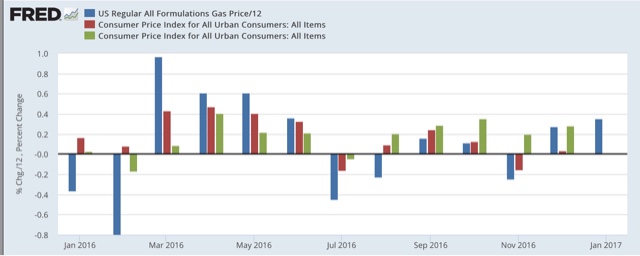
Now that January is over, I can estimate the inflation rate based on the increase in gas prices. I take the percentage increase for gas, divide it by between 10 and 16 to account for its volatility, and that gives me the non-seasonally adjusted monthly inflation rate. In the graph below, covering the last 12 months, the % change in gas prices is the blue bar, the NSA inflation rate is the red bar, and the seasonally adjusted inflation rate is the green bar:

In January 2016, gas prices declined by about 4%, whereas this year they increased by about 3%.
This tells me that the NSA change in consumer prices should be about +0.3%, and the SA change about +0.1%. That will bring the YoY change in the inflation rate to 2.3%.
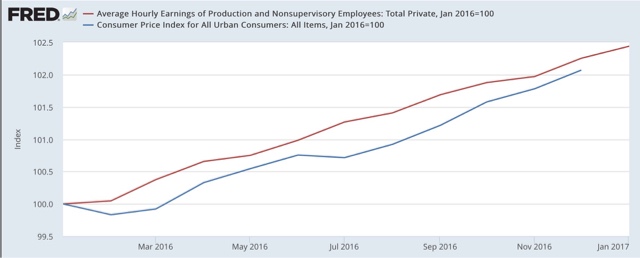
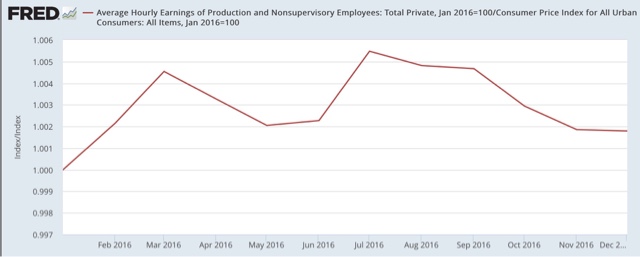
Since nominal nonsupervisory wages are up 2.5% YoY (red in the graph above), this means that they likely have only increased about +0.2% in the entire last 12 months. The graph for real wages through December is below:
That real wages have stalled does not mean that the economy is on the cusp of rolling over, since consumers have other methods of coping, which will be the subject of another post. But it isn’t helpful at all.


