By New Deal democrat Do healthier longevity and better disability benefits explain the long term decline in labor force participation? A few weeks ago I took another deep dive into the Labor Force Participation Rate. There are a few loose ends I wanted to clean up (at least partially). One of the most noteworthy things about the LFPR in the long term is that, for men, it has been declining relentlessly at the rate of -0.3% YoY (+/-0.3%) for over 60 years! Here’s the graph, normed to 100 in 1948, showing the long term decline (blue) and also normed to 100 in 1948, showing the YoY% change +0.3% (red): Once we add +0.3% to the YoY change, the LFPR always stays very close to 100. But what is the *reason* for this very steady decline that has already lasted a lifetime. I want to lay down a hypothesis for further examination later. I believe the secular decline in the LFPR for men, paradoxically, can be explained by two improvements in disability benefits and health: 1. expansions to the definition of disability; and 2. (a) better health care, leading to (b) an increased life span. Here’s the thesis: 60 years ago, men (whose life expectancy from age 20 was only to about 67 years old to begin with) went from abled to disabled to dead over a shorter period of time.
Topics:
Dan Crawford considers the following as important: US/Global Economics
This could be interesting, too:
Joel Eissenberg writes How Tesla makes money
Angry Bear writes True pricing: effects on competition
Angry Bear writes The paradox of economic competition
Angry Bear writes USMAC Exempts Certain Items Coming out of Mexico and Canada
by New Deal democrat
Do healthier longevity and better disability benefits explain the long term decline in labor force participation?
A few weeks ago I took another deep dive into the Labor Force Participation Rate. There are a few loose ends I wanted to clean up (at least partially).
One of the most noteworthy things about the LFPR in the long term is that, for men, it has been declining relentlessly at the rate of -0.3% YoY (+/-0.3%) for over 60 years! Here’s the graph, normed to 100 in 1948, showing the long term decline (blue) and also normed to 100 in 1948, showing the YoY% change +0.3% (red):
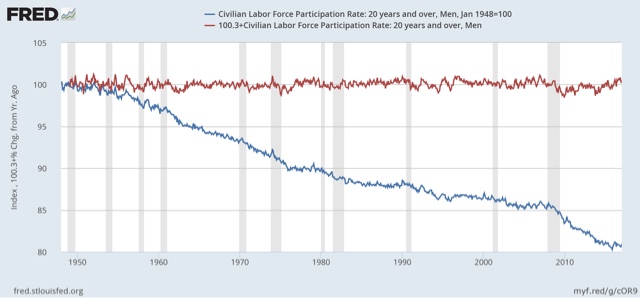 Once we add +0.3% to the YoY change, the LFPR always stays very close to 100.
But what is the *reason* for this very steady decline that has already lasted a lifetime.
I want to lay down a hypothesis for further examination later. I believe the secular decline in the LFPR for men, paradoxically, can be explained by two improvements in disability benefits and health:
1. expansions to the definition of disability; and
2. (a) better health care, leading to (b) an increased life span.
Here’s the thesis: 60 years ago, men (whose life expectancy from age 20 was only to about 67 years old to begin with) went from abled to disabled to dead over a shorter period of time. Now at age 20 they can expect to live to about age 76, and if they get disabled, better health care will keep them alive for a much longer period of time. And more conditions can qualify them for disability. This means that a greater percentage of men qualify for disability, and once on it, they survive beyond working age. (Note that if somebody dies at say age 50 while on disability, they – ahem – are no longer part of the population).
That hypothesis would explain the long term and relentless decline in the LFPR for men.
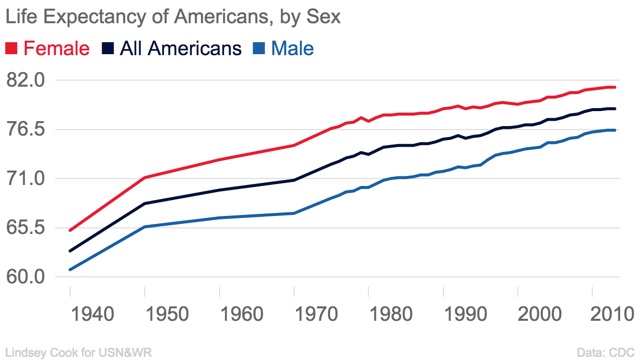
And there is data in support. To begin with, the life span of males who make it to age 20 has increased by about 1 year over every decade:
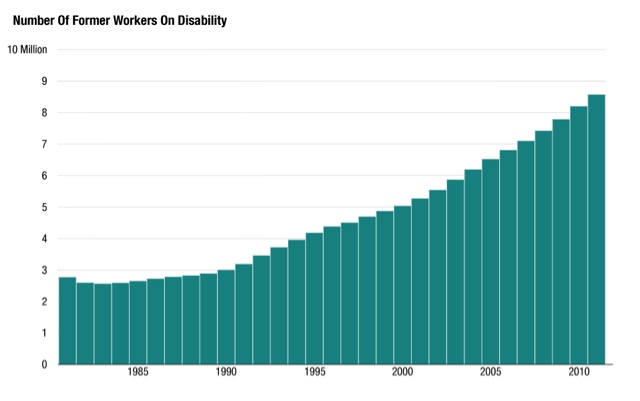
And a much higher percentage of former workers are on disability compared with 35 years ago at least:
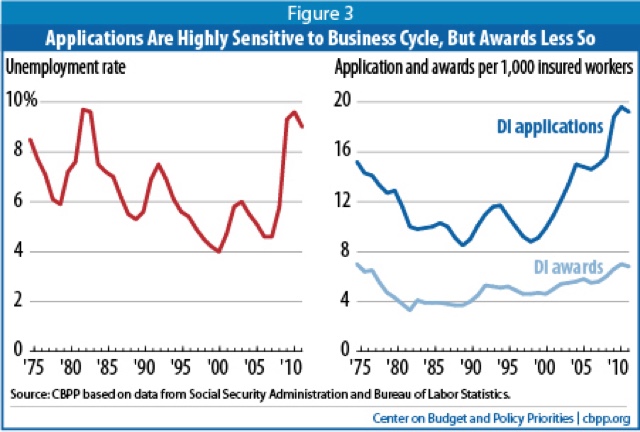
While applications for disability are sensitive to the business cycle, the percentage of awards (after a decline in the early 1980s) have been rising for 30 years:
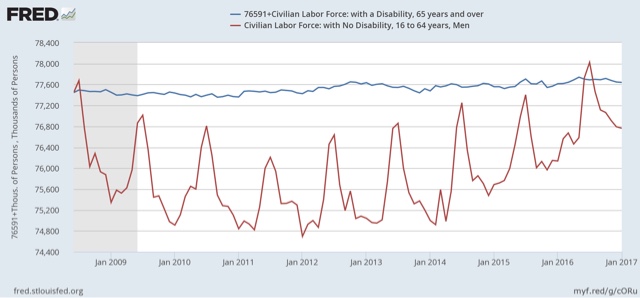
Coverage at the St. Louis FRED only starts in 2008, but the current business cycle fits the description (note: not seasonally adjusted):
Following the recession, the number of men on disability who left the labor force declined almost trivially compared with the number of men not on disability who left the labor force. Those on disability bottomed first (2010-11) compared with the able-bodied (2011-12), and surpassed its 2008 level by 2015, whereas able bodied men not in the labor force just pulled even with their 2008 level in 2016.
Obviously more work needs to be done to flesh out this hypothesis, but I think it is a good fit for the data.
cross posted with Bonddad blog

