By New Deal democrat Measures of underemployment continue to show improvement The unemployment rate, at 4.7%, is generally acknowledged to be decent, although not great. But what of the underemployed? Typically as an economy expands, the U6 (unemployed + underemployed) rate has declined more than the U3 (unemployed only) rate, as shown on the below graph which subtracts U3 from U6, thus leaving us with just the underemployed: As the recovery matures, the two move in tandem. As the economy weakens into a recession, the underemployed tend to feel it fist, as U6 increases more than U3. So the good news for now is that U6 is still declining more than U3. Let’s take a look at several categories of the “underemployed.” First, here are people who are part-time for economic reasons (i.e., they would like a full-time job): This last made a new low several months ago. When we look at the YoY change, we can see that the decline has been decelerating: This may be just noise, or it may be the first sign of a maturing jobs expansion. Next, here are those who are not in the labor force at all, but want a job now: This just made a new low in last week’s report. Note the spike higher following Congress’s termination of extended unemployment benefits at the end of 2013.
Topics:
Dan Crawford considers the following as important: US/Global Economics
This could be interesting, too:
Joel Eissenberg writes How Tesla makes money
Angry Bear writes True pricing: effects on competition
Angry Bear writes The paradox of economic competition
Angry Bear writes USMAC Exempts Certain Items Coming out of Mexico and Canada
by New Deal democrat
Measures of underemployment continue to show improvement
The unemployment rate, at 4.7%, is generally acknowledged to be decent, although not great. But what of the underemployed?
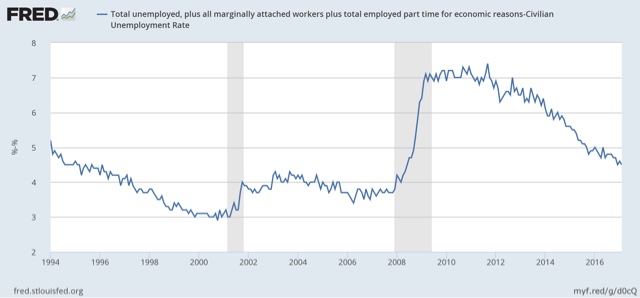
Typically as an economy expands, the U6 (unemployed + underemployed) rate has declined more than the U3 (unemployed only) rate, as shown on the below graph which subtracts U3 from U6, thus leaving us with just the underemployed:
As the recovery matures, the two move in tandem. As the economy weakens into a recession, the underemployed tend to feel it fist, as U6 increases more than U3.
So the good news for now is that U6 is still declining more than U3.
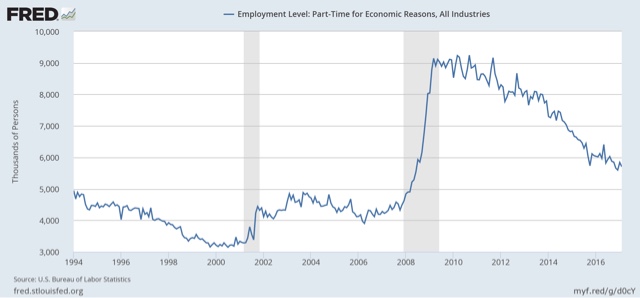
Let’s take a look at several categories of the “underemployed.” First, here are people who are part-time for economic reasons (i.e., they would like a full-time job):
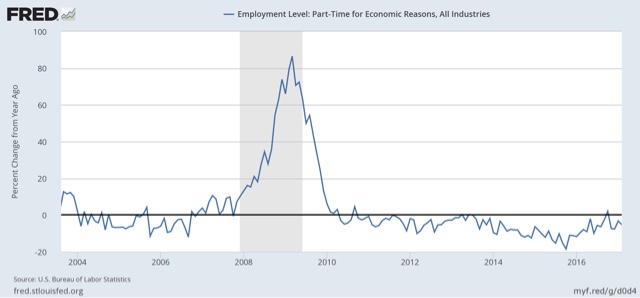
This last made a new low several months ago. When we look at the YoY change, we can see that the decline has been decelerating:
This may be just noise, or it may be the first sign of a maturing jobs expansion.
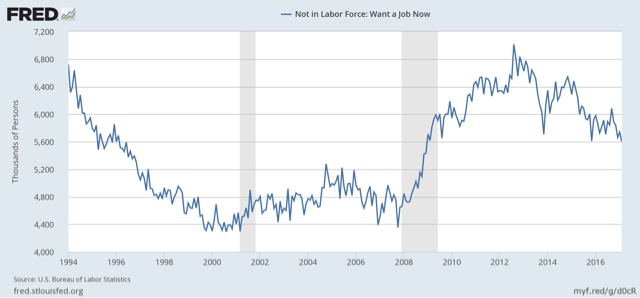
Next, here are those who are not in the labor force at all, but want a job now:
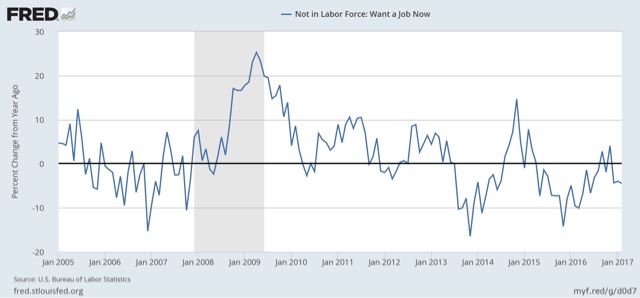
This just made a new low in last week’s report. Note the spike higher following Congress’s termination of extended unemployment benefits at the end of 2013. Here is the YoY change:
Progress here had been decelerating since mid-2015 until several months ago. Again, whether the recent improvement marks a re-accelerating trend, or is just noise in the decelerating trend remains to be seen.
All in all, this is continuing good news. The number of underemployed continues to improve relative to the unemployed, the sign of an economy that is continuing to improve. There are some signs in deceleration in that improvement, but not of a mature expansion that is on the cusp of rolling over.

