From Thomas Edsall in the NY Times At one end of the scale, men continue to dominate. In 2016, 95.8 percent of Fortune 500 CEOs were male and so were 348 of the Forbes 400. Of the 260 people on the Forbes list described as “self-made,” 250 were men. Wealth — and the ability to generate more wealth — must still be considered a reliable proxy for power. But at the other end of the scale, men of all races and ethnicities are dropping out of the work force, abusing opioids and falling behind women in both college attendance and graduation rates. Edsall’s comments are very compatible with this by Deary et al: There is uncertainty whether the sexes differ with respect to their mean levels and variabilities in mental ability test scores. Here we describe the
Topics:
Mike Kimel considers the following as important: Cognition, Equal Inputs vs Equal Outcomes, gender wage gap, IQ, Op-ed, Standard Deviation, Uncategorized
This could be interesting, too:
tom writes The Ukraine war and Europe’s deepening march of folly
Stavros Mavroudeas writes CfP of Marxist Macroeconomic Modelling workgroup – 18th WAPE Forum, Istanbul August 6-8, 2025
Lars Pålsson Syll writes The pretence-of-knowledge syndrome
Dean Baker writes Crypto and Donald Trump’s strategic baseball card reserve
From Thomas Edsall in the NY Times
At one end of the scale, men continue to dominate.
In 2016, 95.8 percent of Fortune 500 CEOs were male and so were 348 of the Forbes 400. Of the 260 people on the Forbes list described as “self-made,” 250 were men. Wealth — and the ability to generate more wealth — must still be considered a reliable proxy for power.
But at the other end of the scale, men of all races and ethnicities are dropping out of the work force, abusing opioids and falling behind women in both college attendance and graduation rates.
Edsall’s comments are very compatible with this by Deary et al:
There is uncertainty whether the sexes differ with respect to their mean levels and variabilities in mental ability test scores. Here we describe the cognitive ability distribution in 80,000+ children—almost everyone born in Scotland in 1921—tested at age 11 in 1932. There were no significant mean differences in cognitive test scores between boys and girls, but there was a highly significant difference in their standard deviations (P<.001). Boys were over-represented at the low and high extremes of cognitive ability. These findings, the first to be presented from a whole population, might in part explain such cognitive outcomes as the slight excess of men achieving first class university degrees, and the excess of males with learning difficulties.
It is also compatible with this by Lynn and Kanazawa:
This paper presents the results of a longitudinal study of sex differences in intelligence as a test of Lynn’s (1994) hypothesis that from the age of 16 years males develop higher average intelligence than females. The results show that at the ages of 7 and 11 years girls have an IQ advantage of approximately 1 IQ point, but at the age of 16 years this changes in the same boys and girls to an IQ advantage of 1.8 IQ points for boys.
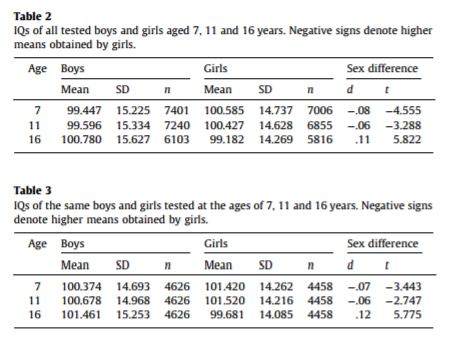
Lynn and Kanazawa’s paper sample is for all kids born in Great Britain during one fine week in March of 1958. The abstract and the paper focuses on mean differences. They seem to mean a lot to the two authors, and most especially Lynn, but to me the differences in mean are small and of lesser importance than other things they note. To mangle a metaphor, the multiplier (when it comes to differences in population outcomes) is the standard deviation. To see what I mean, here are a couple of tables from the Lynn and Kanazawa paper:
Notice the standard deviations are larger for males in every sub-sample. What they tell you is that even if the mean intelligence of men and women is the same, you expect far many more idiots and far many more geniuses among men than among women in most areas of human endeavor that require something identifiable as cognition or IQ.
But it’s not just at the tails; you expect to see more “pretty stupid” and “pretty smart” men than women. The female population simply displays less variance at all ends of the spectrum.
Neuroscientists are also finding that there is more variability in men’s brains than in women’s. Which is to say, patterns of variability in measures of cognition observed in the studies mentioned earlier are very likely to apply to other fields as well.
Now, consider making money. Everyone does it to some extent. But we should see more variation men’s earnings than women’s earnings.
Throw on one more detail: income distributions are truncated at the bottom. There is a minimum wage, after all. People simply don’t get paid less than that. But even in the absence of a minimum wage, people who don’t make enough to survive are very euphemistically removed from the distribution. In fact, in most careers, there is a baseline and most people earn closer to that baseline than to the level that superstars in the field make. People’s abilities may fall on a standard normal distribution, but incomes are described by something that more closely resembles a Chi-Squared distribution.
Which is to say, chunks are taken out from the bottom end of the female and male income distributions. However, a larger proportion of the low end of the male distribution is removed because, due to the larger male variance, more men fall below the floor.
That right there is the gender wage gap, as well as Edsall’s observation.
You disagree? Does today’s America’s differ from what you would expect in a world were men and women have similar intelligence, but men have a great deal more variance? If it does, tell me how.

