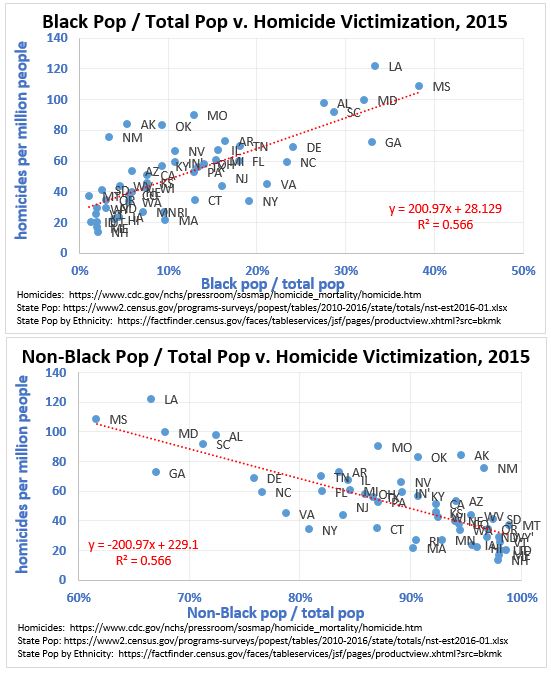
In my last post, I noted a positive correlation between the homicide rate in a state and killings by the police in the same state. In states where the risk of homicide is higher, police killings also tend to be higher. But there is a mitigating race component, and one which (not surprisingly for those who care about data) goes against conventional wisdom: for the same state homicide rate, people are less likely to be shot by cops in states where Black people make up 10% or more of the population than in states where people make less than 10% of the population. Looking at homicides, and accounting for race, it seems there are different dynamics at play among different population groups: (Click to embiggen.) I can’t find murder rates (whether victimization
Topics:
Mike Kimel considers the following as important: homicide rate, Poverty, race, Uncategorized
This could be interesting, too:
tom writes The Ukraine war and Europe’s deepening march of folly
Stavros Mavroudeas writes CfP of Marxist Macroeconomic Modelling workgroup – 18th WAPE Forum, Istanbul August 6-8, 2025
Lars Pålsson Syll writes The pretence-of-knowledge syndrome
Dean Baker writes Crypto and Donald Trump’s strategic baseball card reserve
In my last post, I noted a positive correlation between the homicide rate in a state and killings by the police in the same state. In states where the risk of homicide is higher, police killings also tend to be higher. But there is a mitigating race component, and one which (not surprisingly for those who care about data) goes against conventional wisdom:
for the same state homicide rate, people are less likely to be shot by cops in states where Black people make up 10% or more of the population than in states where people make less than 10% of the population.
Looking at homicides, and accounting for race, it seems there are different dynamics at play among different population groups:
I can’t find murder rates (whether victimization or offender) by race at the state level, but I do note that the data appears to show a clear relationship between the overall murder rate and the ethnic makeup of a given state:

Relative to the rest of the population, there is an elevated homicide rate (both offense and victimization) in our Black population. Thus, if we want to reduce the homicide rate, perhaps the opportunity is greatest in understanding why the homicide rate is as high as it is in the Black community.
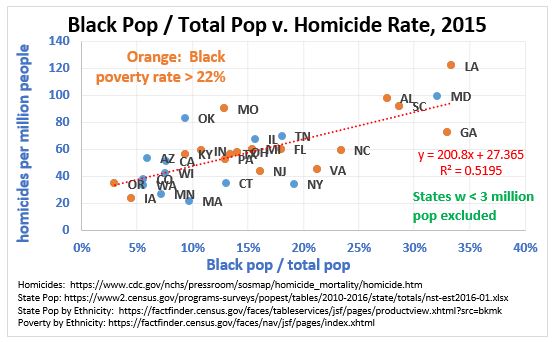
Poverty is often mentioned as a factor driving crimes in general, and sometimes homicides in particular. To examine whether that is the case here, the next graph shows the percentage of a state’s population that is Black on one axis, and the homicide (victimization) rate on the other axis. States with fewer than 3 million than people are omitted. Additionally, states with a Black poverty rate in excess of 22% (which is approximately the median poverty rate for the Black population, measured by state) are colored orange:
While the homicide rate is lower in states with less poverty (median of 42 murders per million v. 58), there is no clear pattern that would indicate that poverty rates the Black community are a primary driver of the murder rates according to the above graph. If that isn’t clear to you, the graph below includes the same information but from a different perspective.
So the data seems to indicate that reducing poverty in the Black community, while a laudable goal for any number of reasons, is probably not going to have a strong influence on the homicide rate.
This post is getting long so it’s time to wrap it up. I note, however, that I have collected other data (e.g., pop density, measures of segregation, education levels, single parenthood, etc.) which hopefully I can put into similar graphs in later posts. Perhaps among these variables will be an indication as to what can be done to reduce the homicide rate and reduce the number of victims, particularly in the Black community.
One final note… if anyone knows where I can get data on the homicide rate by different population groups by state please let me know.
—
Update, 7/31/2017, 5:21 PM PST
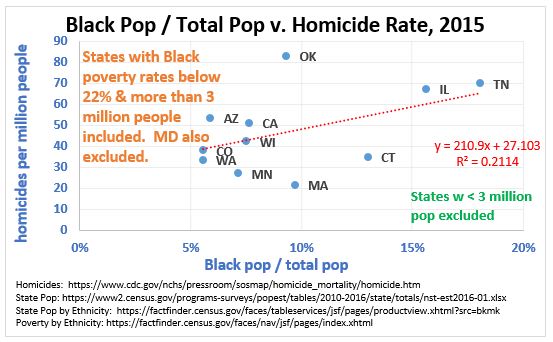
As should be obvious from the wording of the post, I was concerned that someone might misconstrue the second to the last graph. To make the homicide relationship more obvious, I included the last graph as a companion piece. However, a habitually rude offender claims to believe that the states with a relatively low level of Black poverty (i.e., the blue points on the second to the last graph) have a different relationship between Black poverty and homicide rates than the states with relatively high levels of Black poverty, and all of that is being somehow masked by the existence of Maryland. So… below please find the same graph, redone, including only the states with low levels of Black poverty, but leaving out Maryland. (Note that the slope of the graph below is actually steeper than the slope of the graph with a broader set of data though the fit isn’t as high.)


