Bitcoin prices are an attractive topic for people who study behavioral finance. Behavioral means anything but rational expectations, Nash equilibrium and the Efficient Market Hypothesis. It is easy to argue that the fundamental value of Bitcoin is zero — it doesn’t yield income and there is no limit on the supply of cryptocurrency, because new cryptocurrencies can be introduced. I certainly consider the positive price of Bitcoin to be a failure of the efficient market hypothesis. The case is also attractive, because the price certainly seems to roughly correspond to what one would expect based on one of the oldest beharioral models. For decades psychologists and experimental economists have noted that people tend to usually assume that time series are
Topics:
Robert Waldmann considers the following as important: US/Global Economics
This could be interesting, too:
Joel Eissenberg writes How Tesla makes money
Angry Bear writes True pricing: effects on competition
Angry Bear writes The paradox of economic competition
Angry Bear writes USMAC Exempts Certain Items Coming out of Mexico and Canada
Bitcoin prices are an attractive topic for people who study behavioral finance. Behavioral means anything but rational expectations, Nash equilibrium and the Efficient Market Hypothesis. It is easy to argue that the fundamental value of Bitcoin is zero — it doesn’t yield income and there is no limit on the supply of cryptocurrency, because new cryptocurrencies can be introduced. I certainly consider the positive price of Bitcoin to be a failure of the efficient market hypothesis.
The case is also attractive, because the price certainly seems to roughly correspond to what one would expect based on one of the oldest beharioral models. For decades psychologists and experimental economists have noted that people tend to usually assume that time series are mean reverting — guessing that what recently went up will soon go down. People are then surprised if a variable goes up and up and interpret this as something other than random fluctuation, as a new trend. Basically, the story is that people treat a random walk as if it were a stationary process around a broken trend. This isn’t totally surprising as time series econometricians find it exceedingly difficult to distinguish random walks from stationary processes around broken trends.
There are many models in which agents switch back and forth from forecasts in which they predict mean reversion to chasing trends — forecasts in which they expect a variable to continue to change in the direction it has recently changed. In the models, agents switch based on the past performance of the two forecasting rules. Hands are waved so that all don’t switch at the same time and people never become firmly and permanently convinced that one rule is best.
I wrote a little MatLab program in which such agents trade an asset (with no particular fundamental value) & simulated the asset price a few times. Of a few dozen trials one looked like this ( remember you have to click more to see figures)
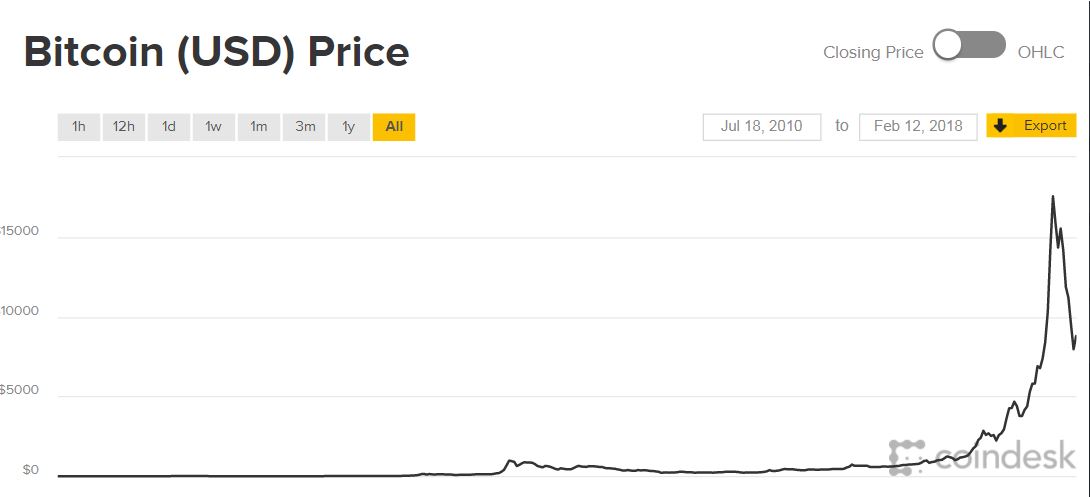
Hmm does that look familiar ? The price goes up to a peak around 100,000 times the initial price. It is stable for long periods and occasionally shoots up and crashes (you know bubbles). The periods of stability are periods in which most agents forecast mean reversion. The periods of extreme instability are periods in which 90% of agents extrapolate. The upper limit of 90% extrapolators is one of 4 free parameters I fiddle (the others are variance and persistence of unexplained shocks to price and persistence of beliefs about which rule works best).
As noted above (and as is obvious) the graph is cherry picked. It is the one of a few dozen which looks most like the actual time series of bitcoin prices (here fairused from Coindesk.com).

