In October the real trade deficit fell to ,133 (million 2012 $) from the third quarter average of ,713 (million 2012 $), a 6.6% improvement. This implies that the fourth quarter is starting with trade making a significant large boost to fourth quarter real GDP growth. Remember, the trade balance is the difference between two very large numbers so a small change in either exports or imports can generate a large change in the balance. The year over year percent change in exports is down -0.6% and imports have fallen -4.1%. But since the December, 2018 peak, the real trade balance has contracted -13.2%. When you look at the details of US real trade, the changes in trade stem largely from oil and consumer goods. Other trade categories, like food,
Topics:
Spencer England considers the following as important: Uncategorized
This could be interesting, too:
tom writes The Ukraine war and Europe’s deepening march of folly
Stavros Mavroudeas writes CfP of Marxist Macroeconomic Modelling workgroup – 18th WAPE Forum, Istanbul August 6-8, 2025
Lars Pålsson Syll writes The pretence-of-knowledge syndrome
Dean Baker writes Crypto and Donald Trump’s strategic baseball card reserve
In October the real trade deficit fell to $79,133 (million 2012 $) from the third quarter average of $84,713 (million 2012 $), a 6.6% improvement. This implies that the fourth quarter is starting with trade making a significant large boost to fourth quarter real GDP growth. Remember, the trade balance is the difference between two very large numbers so a small change in either exports or imports can generate a large change in the balance. The year over year percent change in exports is down -0.6% and imports have fallen -4.1%. But since the December, 2018 peak, the real trade balance has contracted -13.2%.
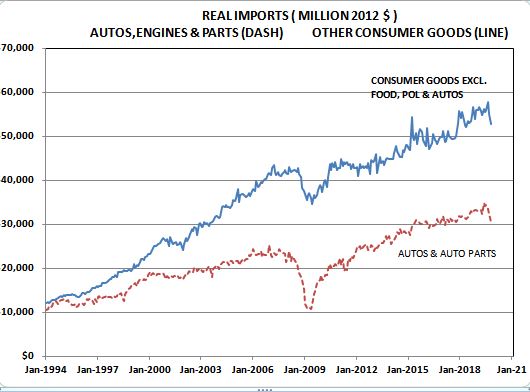
When you look at the details of US real trade, the changes in trade stem largely from oil and consumer goods. Other trade categories, like food, industrial materials, capital goods are each showing relatively small changes that are largely offsetting each other. For the most part both imports and exports of other goods have been stagnant for the past year. The drop in auto and consumer goods imports reflects several points.
The new world of the US being an open economy after the leap . . .
One, it is a feature of the new world of the US being an open economy to an extent that just did not exist before about 1980. In the old days if auto and other consumer goods demand weakened it would quickly show up as a negative for industrial production. But now it shows up as a drop in imports as the economic adjustment is transferred to other economies. This is a very significant factor in the point that the US has fewer recessions now – seemingly every ten years rather than every four years. Nevertheless, the year over year change in US industrial production of cars and light trucks was -5.3%, -1.3% and -2.2% in the first, second and third quarters of 2019. This compares to a reading of -13.4% in October. Obviously, some of this is strike related so auto and truck output will rebound some but whether it will regain the 1.0 to 1.2 million units of recent years is an open question.
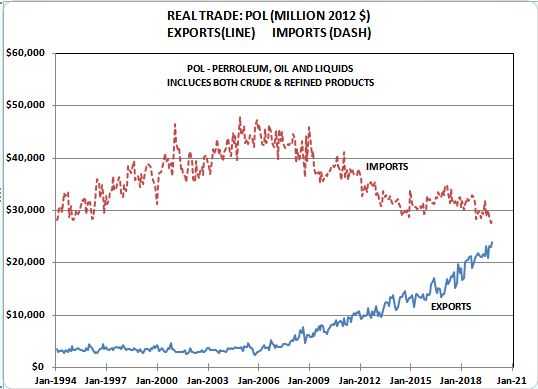
In oil the increased supply from fracking is showing up as both lower imports and a surge in exports as the net trade deficit in oil has almost vanished in both nominal and real terms. In the trade balance the sharp contraction in the oil deficit has been largely offset by a surge in consumer goods imports. I see this as another piece of evidence showing that the trade deficit is driven by the imbalance between US savings and investment. The federal deficit is negative savings so it is a major factor in the US domestic savings – investment and current account deficits. The large structural trade deficit since 1980 has been driven largely by the republican tax cuts that reduced US savings.
The large drop in the October real trade deficit was driven almost exclusively by plunges in auto and consumer goods imports. Obviously part of the drop in auto engines and parts was a product of the GM strike that caused some plants to shut down. When a plant closes they do not need to import components. But real auto imports have fallen – 8.6% over the last two months. Historically, auto imports have been extremely skewed towards luxury cars and econoboxes. So auto imports tended to hold up better when auto sales weakened as people trade down, supporting the bottom end of the market while the upper end is just not that cyclical. In October, real consumer goods imports excluding food, oil and autos fell – 6.2% below its third quarter
The consensus view seems to be that the plunge in real trade in October was a one month phenomenon and that trade will quickly rebound to the higher levels of earlier this year. Maybe, but this analysis suggests that this consensus expectation probably is overly optimistic.
While I am discussing trade it may be timely to warn about the price indices for import constructed by the BLS and Census. The data for these price indices is collected when the goods are freight on board (FOB) before they enter customs where the tariff is imposed.. So these price indices do not include tariffs. This does not seem to be widely recognized and I have seen analysis that assumed they did include tariffs.


