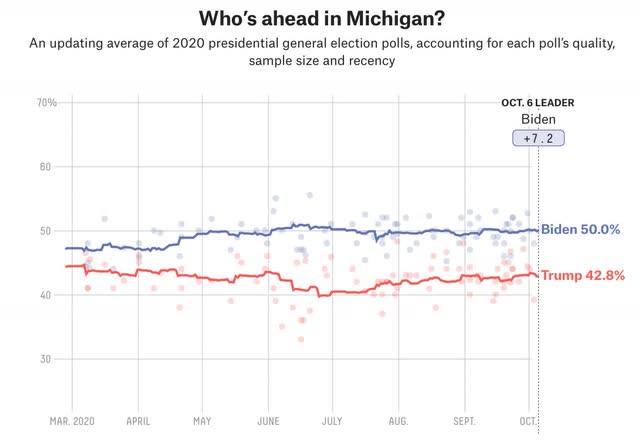
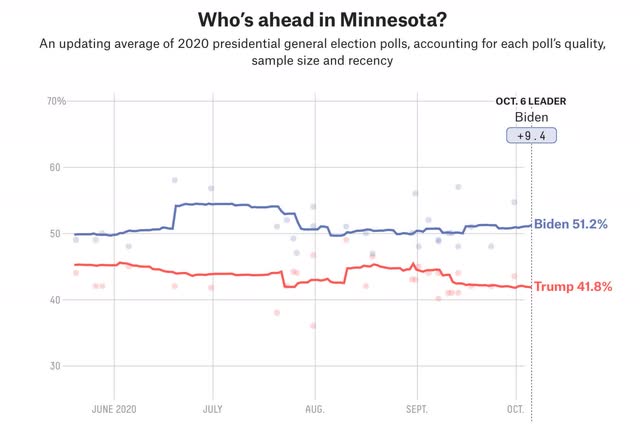
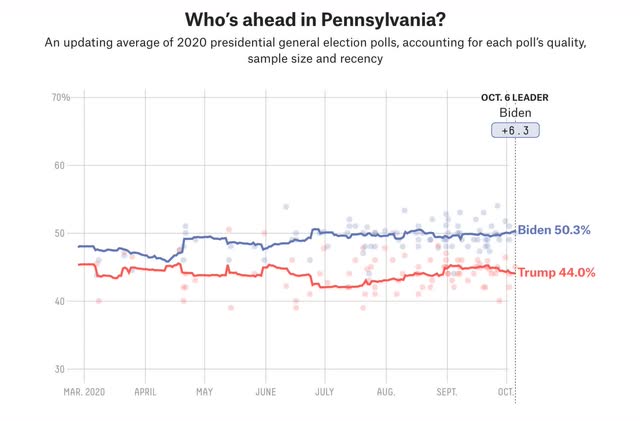
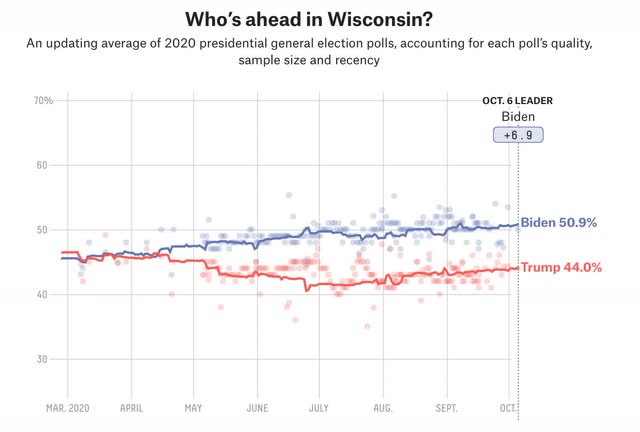
In 2020, the “Blue Wall” is holding At 10 a.m. Eastern time we’ll get the JOLTS report for August. I plan on posting on that later today, but in the meantime here’s an update on the Midwest “Blue Wall” that failed in the 2016 election. Below are the smoothed poll results for Michigan, Minnesota, Pennsylvania, and Wisconsin through yesterday: Figure 1 Despite the wide margins in all 4 States, Nate Silver gives Trump an 11% chance of winning Michigan, plus 10% in Minnesota, and 17% in both Pennsylvania and Wisconsin. What is remarkable about all 4 graphs is how *stable* the results have been for the past 4 months, particularly in Michigan and Wisconsin. Minnesota’s variability during the summer appears to be an artifact of very light state polling.
Topics:
NewDealdemocrat considers the following as important: politics
This could be interesting, too:
Robert Skidelsky writes Lord Skidelsky to ask His Majesty’s Government what is their policy with regard to the Ukraine war following the new policy of the government of the United States of America.
Joel Eissenberg writes No Invading Allies Act
Ken Melvin writes A Developed Taste
Bill Haskell writes The North American Automobile Industry Waits for Trump and the Gov. to Act
In 2020, the “Blue Wall” is holding
At 10 a.m. Eastern time we’ll get the JOLTS report for August. I plan on posting on that later today, but in the meantime here’s an update on the Midwest “Blue Wall” that failed in the 2016 election.
 Figure 1


Despite the wide margins in all 4 States, Nate Silver gives Trump an 11% chance of winning Michigan, plus 10% in Minnesota, and 17% in both Pennsylvania and Wisconsin.
What is remarkable about all 4 graphs is how *stable* the results have been for the past 4 months, particularly in Michigan and Wisconsin. Minnesota’s variability during the summer appears to be an artifact of very light state polling. Pennsylvania did tighten somewhat in September but has since reverted to baseline. Also, note that Biden has 50% or higher support in all 4 States.
I don’t think Nate’s model takes into account this stability. If I run 50 polls over 3 months, and all 50 give an edge to one candidate, vs. a volatile trend where the lead changes, or vs. a situation with light polling, I have to think the first scenario is much more reliable than the 2nd or 3rd. In 2016, by contrast, there was much less state-level polling, and Hillary Clinton’s lead was considerably more variable.
With only 4 weeks to go until Election Day (and with a significant percentage of people already having cast their ballots), I am increasingly encouraged that Biden’s lead is not going to be meaningfully impacted by news events between now and then
