The 2020 Presidential election nowcasts and forecast: growing evidence for a likely Biden blowout For the past three weeks I have posted a projection of the Electoral College vote based solely on State rather than national polls (since after all that is how the College operates) that have been reported in the last 30 days. Here’s how it works: – States where the race is closer than 3% are shown as toss-ups. – States where the range is between 3% to 5% are light colors. – States where the range is between 5% and 10% are medium colors. – States where the candidate is leading by 10% plus are dark colors. Here is the updated map through July 11: There are no flips, except that I noticed I had overlooked a poll last month of Nebraska that actually showed a
Topics:
NewDealdemocrat considers the following as important: politics
This could be interesting, too:
Robert Skidelsky writes Lord Skidelsky to ask His Majesty’s Government what is their policy with regard to the Ukraine war following the new policy of the government of the United States of America.
Joel Eissenberg writes No Invading Allies Act
Ken Melvin writes A Developed Taste
Bill Haskell writes The North American Automobile Industry Waits for Trump and the Gov. to Act
The 2020 Presidential election nowcasts and forecast: growing evidence for a likely Biden blowout
For the past three weeks I have posted a projection of the Electoral College vote based solely on State rather than national polls (since after all that is how the College operates) that have been reported in the last 30 days.
Here’s how it works:
– States where the race is closer than 3% are shown as toss-ups.
– States where the range is between 3% to 5% are light colors.
– States where the range is between 5% and 10% are medium colors.
– States where the candidate is leading by 10% plus are dark colors.
Here is the updated map through July 11:
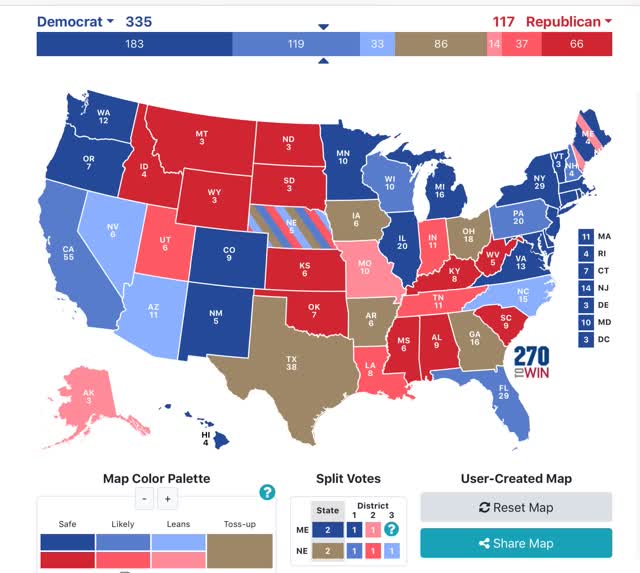
There are no flips, except that I noticed I had overlooked a poll last month of Nebraska that actually showed a slight Biden lead. In Biden States, Arizona weakened and several others strengthened. In Trump States, a number in the Mississippi valley weakened significantly. And this morning another Texas poll showed a Biden lead, although not enough to move that State out of the “toss-up” range.
As has been the case for the past two weeks, if Biden simply wins the States in which he leads by 5% or more in the polling, he would win the Electoral College, without even winning a single “toss-up” or “lean Biden” State as shown on the map.
Trump continues to have close to his worst polling in the past 2 1/2 years, as shown in Nate Silver’s most current measure of Trump approval:
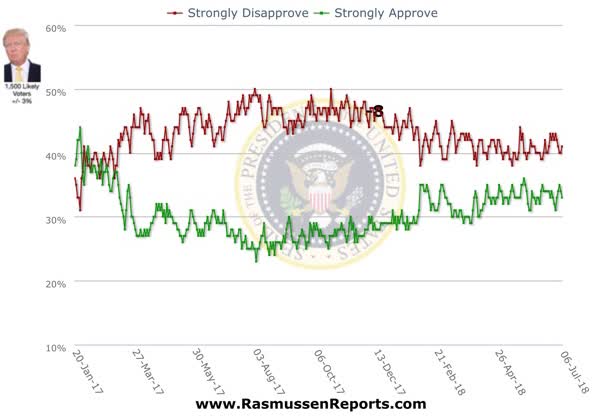
Although he is a GOP pollster, I think Rasmussen’s measure of strong approval vs. strong disapproval is also very telling. The theory is that those with strong opinions aren’t going to change, so what remains are those with weak opinions. Here is what that looked like for Trump’s first 1 1/2 years:
And here is the same metric for the past 2+ years:
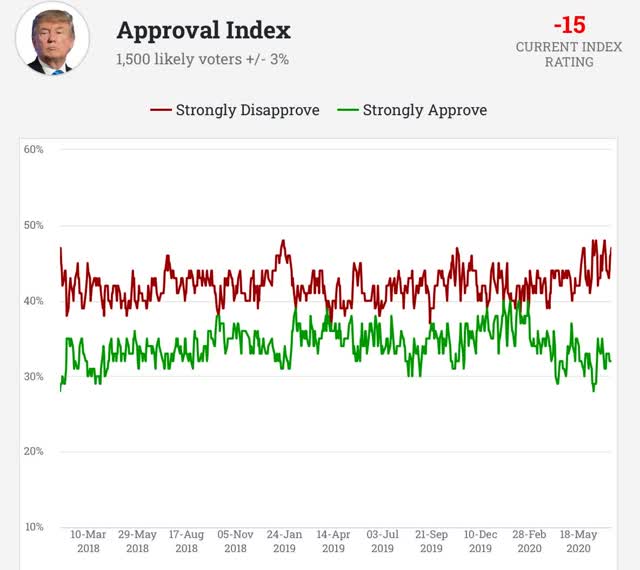
Strong disapprovers are at ~45%, about the worst level in the past two years. Only during the ACA repeal attempts during 2017 did Trump fare significantly worse. It would be extremely difficult for Trump to overcome that disadvantage, especially since late deciders almost always break towards the challenger.
Next, let’s look at some econometric models. First, here is the “Bread and Peace” econometric model, first showing its historical record through 2016 (the creator, Douglas Hobbs, has not made any update for the 2020 election):
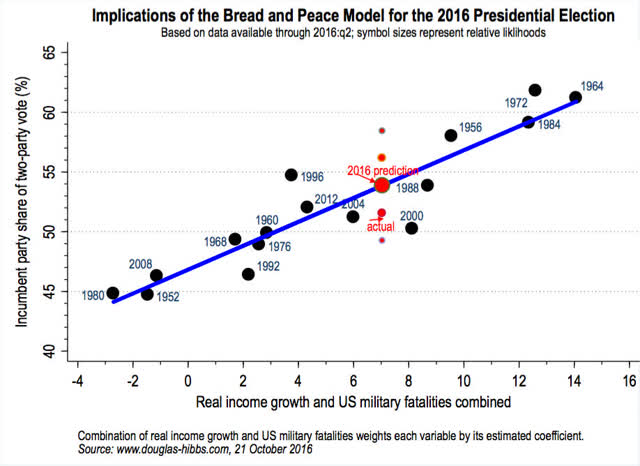
This model measures the change in real disposable personal income per capita, and adds casualties in wars to arrive at its forecast (whether pandemic deaths would be equivalent is completely unknown, but obviously would make a big difference).
Here is what the change in real personal income per capita looks like, first historically through the last recession, and now the past few months:
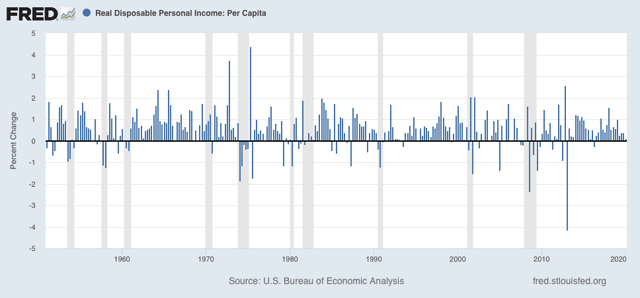
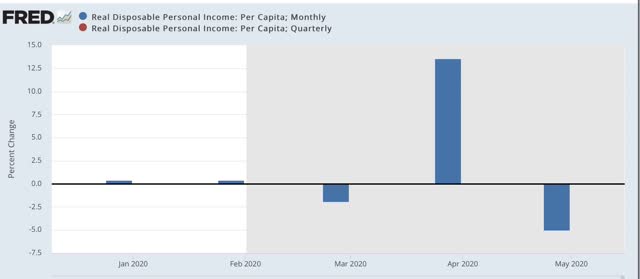
The number, while not negative, was in the danger zone even before March. Since then, the stimulus checks in April greatly helped this metric for one month, but if June is as poor as May, it will be completely undone. If pandemic deaths carry any weight at all close to casualties in war, the model forecasts disaster for Trump.
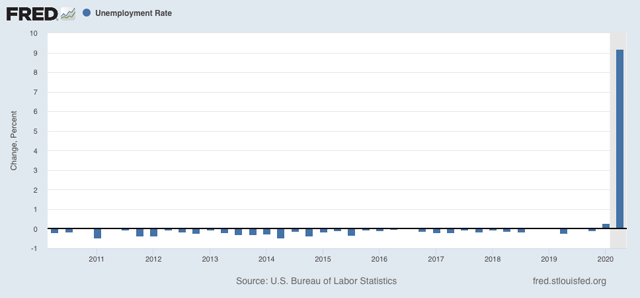
Another model recently put forward by a Fed watcher (sorry, I forgot her name) demonstrated that an increase of 0.4% off its best levels in the unemployment rate in the quarters before an election has historically indicated a loss by the incumbent. Needless to say, this indicator is awful for Trump now:
But all of the above are nowcasts. They change right up until the election with incoming polling and/or economic data.
By contrast, the best *forecast* model I have seen takes Q1 polls, plus the Index of Leading Indicators at the end of the Q1 to predict how the economy will be behaving just before Election Day. So here is an update through May of the LEI:
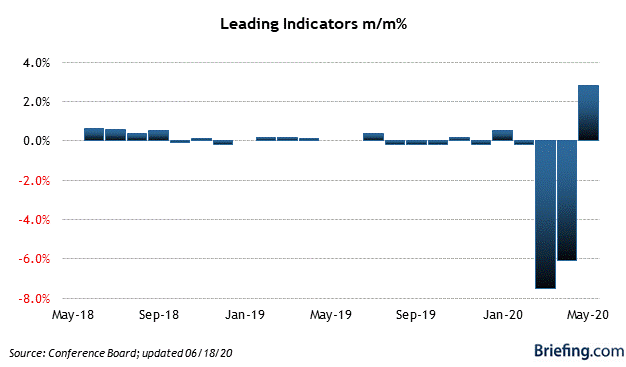
Even May’s big bounce barely made a dent in the March and April declines. Needless to say, this forecasts a Biden blowout and is not affected by the vicissitudes of polling between now and November. In essence, it is already set in stone. All of this, in turn, was driven by the pandemic.
This leads me to the following: at this point, I think I can be blunt. Trump has about 7 weeks to turn around the pandemic. If Labor Day comes and goes and the pandemic is still raging anywhere near as bad as it is now, Trump is going to lose the popular vote, and lose it badly, making an electoral college victory virtually impossible.
And if so, it is very likely that the Democrats win the Senate as well. In the past week, polling has confirmed a big lead in Arizona, a moderate lead in Maine, and slight leads in Iowa and North Carolina. Even the Alaska Senate race isn’t solidly GOP.
Of course, keeping in mind 2016, Democrats should behave as if Biden, and every House, Senate, and State candidate is running 2% behind, and keep the pedal to the metal.