Coronavirus dashboard for April 16: if new infections have passed peak, what pace of decline can we expect? Here is the update through yesterday (April 15). Significant new items are in italics In the US, the only significant development yesterday was that deaths rose to yet another new daily high, while infections continued to be below last week’s peak. Since I want to look ahead, now that lockdowns appear to have worked and the number of new daily infections appears to have peaked, what should the slope of declines look like? For that, I turned to three countries in Europe all of which have seen their peaks: Spain, Germany, and Italy. Here’s what each of them look like, in order: Spain – in the 3 weeks since peak, cases have declined by about 50%
Topics:
NewDealdemocrat considers the following as important: Healthcare
This could be interesting, too:
Bill Haskell writes Families Struggle Paying for Child Care While Working
Joel Eissenberg writes RFK Jr. blames the victims
Joel Eissenberg writes The branding of Medicaid
Bill Haskell writes Why Healthcare Costs So Much . . .
Coronavirus dashboard for April 16: if new infections have passed peak, what pace of decline can we expect?
Here is the update through yesterday (April 15). Significant new items are in italics
In the US, the only significant development yesterday was that deaths rose to yet another new daily high, while infections continued to be below last week’s peak.
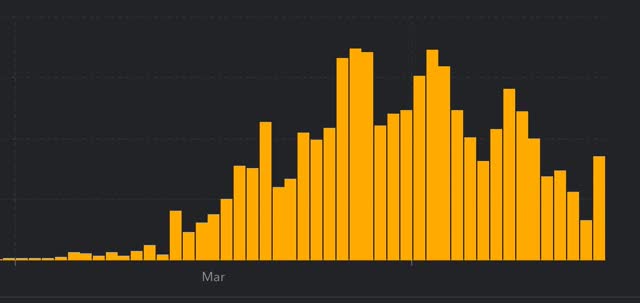
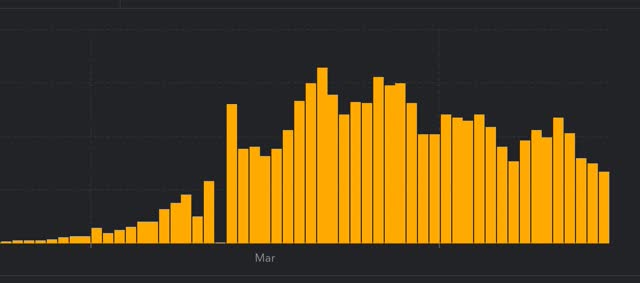
Since I want to look ahead, now that lockdowns appear to have worked and the number of new daily infections appears to have peaked, what should the slope of declines look like? For that, I turned to three countries in Europe all of which have seen their peaks: Spain, Germany, and Italy. Here’s what each of them look like, in order:
Spain – in the 3 weeks since peak, cases have declined by about 50% total from 10,000 per day to 5,000 per day (or 17%/week):
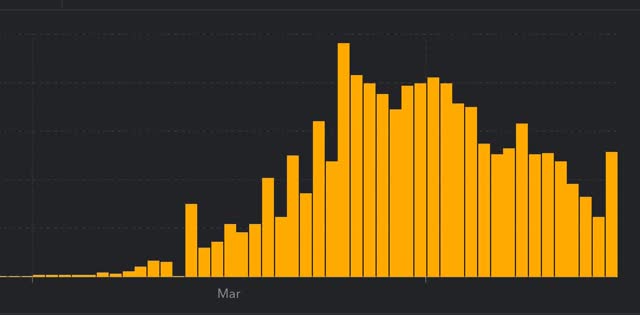
Figure 1
Germany – in the 2 weeks since peak, cases have declined by about 60% total from 8,000 per day to 3,200 per day (or 30%/week):
Italy – in the nearly 4 weeks since peak, cases have declined by about 55%, also from about 8,000 per day to 3,400 per day (or 14%/week)
Of the three countries, Germany has been doing an excellent job of testing, tracing, and isolating, so I do not expect the US to follow that trajectory. On the other hand, in the 6 days since its apparent peak, on a three day rolling bases new cases in the US has declined about -19% from peak. So, conservatively we can hope for at least 15% declines weekly from peak, or about a 60% decline to roughly 13,000 cases per day by the first week of May. That will be my next forward-looking marker.
Now, let’s look at yesterday’s numbers.
Number and rate of increase of Reported Infections (from Johns Hopkins via arcgis.com)
- Number: up +29,979 to 639,664 (vs. 35,219 peak on April 10)

- ***Rate of increase: day/day: 5% (vs. 6% for the past week, and 5% on April 12)
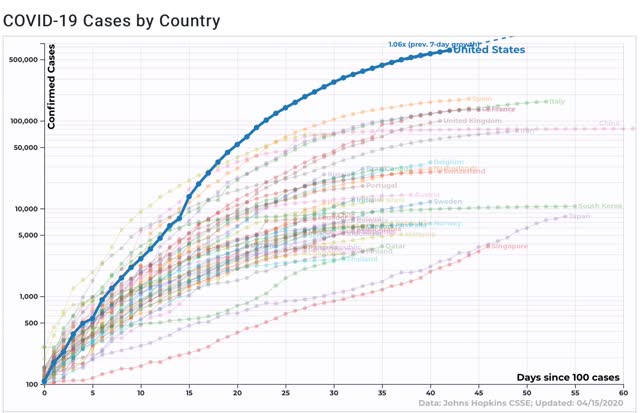
The number of new infections has declined from a recorded peak last week. Hopefully the increase in the past two days is just temporary noise.
Number of deaths and infections and rate of increase of testing (from COVID Tracking Project)
- ***Number of deaths: Total 28,160 increase of +2,492 day/day (new daily high)
- Rate: increase of 10% day/day vs. average of 10% in past week
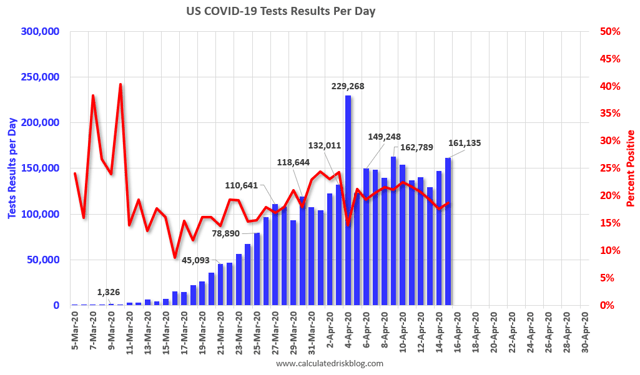
- Number of tests: 161,135, up +14,521 day/day (vs. 163,769 peak on April 9)
- Ratio of positive tests to total: 5.3:1 (vs. 5.8:1 peak on March 28)
- Partial restrictions on business (bars, restaurants): 5 States (IA, ND^, NE, UT*^, WY^) 9.7 million, 2.9%
- School closure only: 2 States (AR^, SD*) 3.9 million, 1.2%
- East Coast consortium: 7 States: CT, DE, MA, MD, NJ, NY, PA, RI
- West Coast consortium: 3 States: CA, OR, WA
- Also under development: 1 State: UT
- Midwest consortium*: 3 States: MI, MN, WI
*procurement of medical supplies only
Summary for April 15
Here’s how we stand (meaningful new developments in italics):
- About 95% of the total US population remains under total lockdown.
- In States with no lockdowns, a meat-packing plant in South Dakota has emerged as the new national hotspot.
- The number of daily new infections appears to have plateaued in the past week, and is slightly lower, while deaths made another new high. Per my introductory section above, I am looking for a decline of roughly 15%/week in new infections if the peak has indeed been reached, so long as the lockdowns stay in place.
- The number of daily tests has improved a little bit from about 140-150,000. We likely are continuing to miss a large percent of new infections. My personal suspicion is that the actual number of total infections in the US is between 2-5x the official number.
- The Trump Administration has taken no steps – and realistically will never take steps -towards a nationwide “test, trace, and quarantine” plan that will be needed to lift lockdowns, or to assist States to do so, and is using a haphazard, secret, and likely corrupt method of distributing vital medical equipment.
- In the absence of federal action, 14 States are either coordinating in making purchases of the necessary equipment, and/or to develop their own “test, trace, and quarantine” plan, but specifics in how to accomplish that have not emerged.
- Some private companies are developing technologies or equipment to be used in a “test, trace, and quarantine” regimen. Abbott Labs has premiered a test which it says can be administered 1,000,000x/day.
