Coronavirus dashboard for October 27: The EU is now worse than the US Total US confirmed infections: 8,777,432* Average US infections last 7 days: 71,833 (new record high) Total US deaths: 226,695 Average US deaths last 7 days: 806 (vs. recent low of 689 11 days ago) *I suspect the real number is about 15,000,000, or 4.5% of the total US population Source: COVID Tracking Project The pandemic is once again raging out of control in parts of the country, and it is likely to be far worse over the winter months. Let’s start today by comparing the US with the EU countries plus Canada. While in Canada the virus is still under control, on average, the EU is seeing nearly twice as many daily infections per capita as the United States: The EU is at parity with
Topics:
NewDealdemocrat considers the following as important: Healthcare
This could be interesting, too:
Bill Haskell writes Families Struggle Paying for Child Care While Working
Joel Eissenberg writes RFK Jr. blames the victims
Joel Eissenberg writes The branding of Medicaid
Bill Haskell writes Why Healthcare Costs So Much . . .
Coronavirus dashboard for October 27: The EU is now worse than the US
Total US confirmed infections: 8,777,432*
Average US infections last 7 days: 71,833 (new record high)
Total US deaths: 226,695
Average US deaths last 7 days: 806 (vs. recent low of 689 11 days ago)
*I suspect the real number is about 15,000,000, or 4.5% of the total US population
Source: COVID Tracking Project
The pandemic is once again raging out of control in parts of the country, and it is likely to be far worse over the winter months.
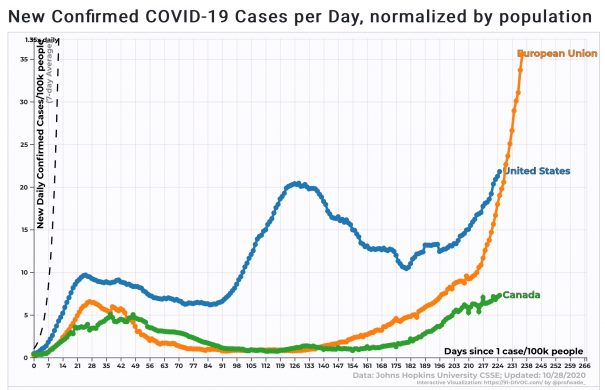
Let’s start today by comparing the US with the EU countries plus Canada.
While in Canada the virus is still under control, on average, the EU is seeing nearly twice as many daily infections per capita as the United States:
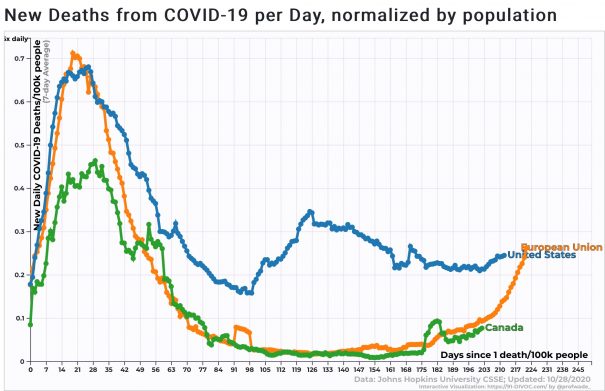
The EU is at parity with the US now in terms of deaths, and that can be expected to rise further as well:
Here are new infections and deaths per capita for the US as a whole:
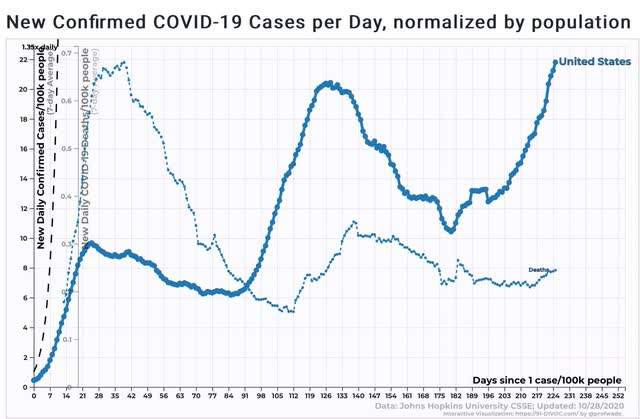
Although the infection rate is worse than ever, because of either a change in the demographics of those infected (younger vs. old people) and/or better medical treatments, the death rate is nowhere near what it was early in the pandemic.
The two worst States for both infections and deaths are North and South Dakota, shown below:
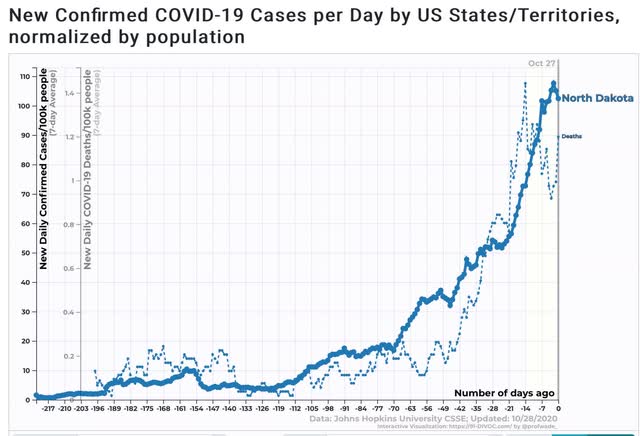
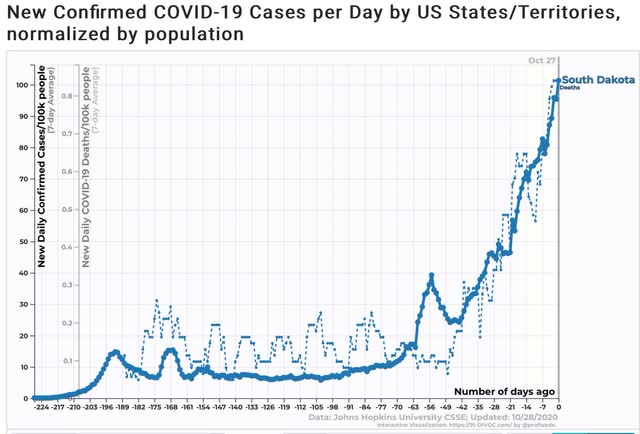
Again, the death rate is nowhere near that of NY or NJ early in the pandemic.
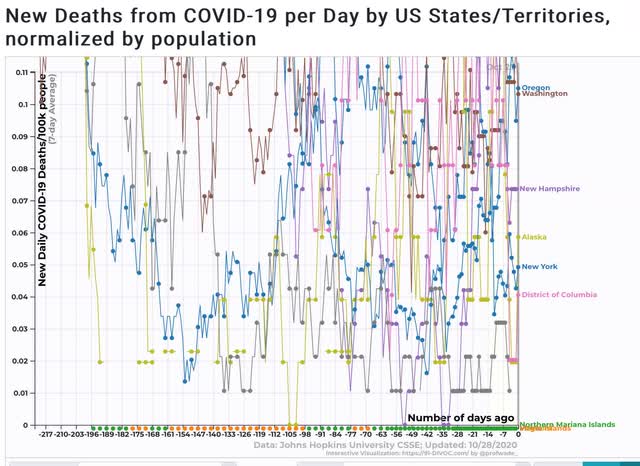
Turning to the bottom 10 US jurisdictions, the infection rate has recently been rising in all of them except for some Pacific islands and the three States of northern New England:
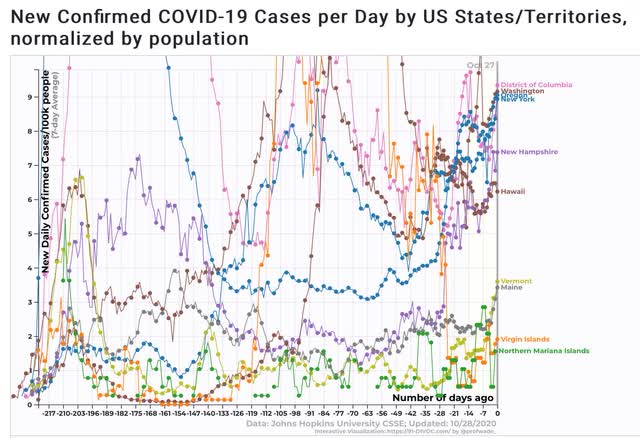
The same is true of the bottom 10 US jurisdictions for deaths – although again this is not a “bad” death rate compared with earlier in the pandemic, or compared to other States and countries:
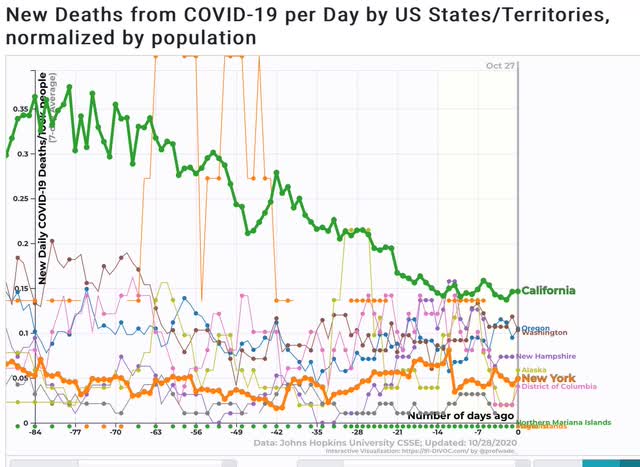
Finally, New York is still in the bottom 10 for per capita infections, and California just above – but both show recent increases:
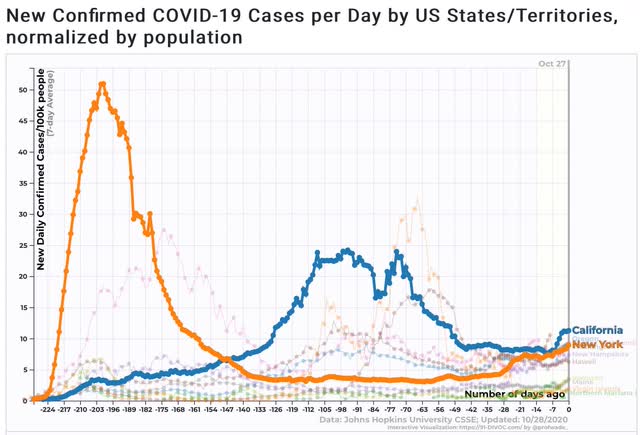
In terms of deaths, New York is still doing well, and California is still slowly declining – although that may change with the recent uptick in infections there:
