Coronavirus dashboard for October 9: everybody has to touch the hot stove at least once Total confirmed US infections: 7,605,218* Average infections last 7 days: 46,869 Total US deaths: 212,762 *Actual number is probably 5 to 7 million higher, or about 4% of the total US population Source: COVID Tracking Project In the last 4 weeks, the average number of new infections has risen again. Here is the breakdown by regions: Here is the same for deaths: The early outbreak in the NYC metro area remains the single most deadly outbreak per capita by far. So here is the rate of deaths for the past 12 weeks: The South and parts of the West, which were the epicenters of the second outbreak during the summer, have seen their numbers decline, while the
Topics:
NewDealdemocrat considers the following as important: Healthcare
This could be interesting, too:
Bill Haskell writes Families Struggle Paying for Child Care While Working
Joel Eissenberg writes RFK Jr. blames the victims
Joel Eissenberg writes The branding of Medicaid
Bill Haskell writes Why Healthcare Costs So Much . . .
Coronavirus dashboard for October 9: everybody has to touch the hot stove at least once
Total confirmed US infections: 7,605,218*
Average infections last 7 days: 46,869
Total US deaths: 212,762
*Actual number is probably 5 to 7 million higher, or about 4% of the total US population
In the last 4 weeks, the average number of new infections has risen again. Here is the breakdown by regions:

Here is the same for deaths:
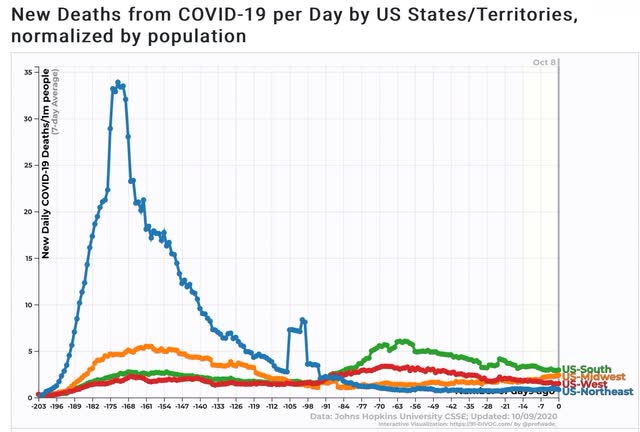
The early outbreak in the NYC metro area remains the single most deadly outbreak per capita by far. So here is the rate of deaths for the past 12 weeks:
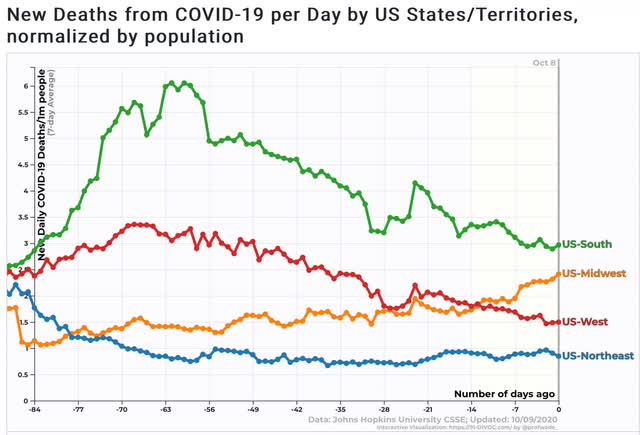
The South and parts of the West, which were the epicenters of the second outbreak during the summer, have seen their numbers decline, while the Midwest in particular has seen its number increase sharply. The increase in the Northeast is primarily being driven by Massachusetts and Rhode Island, although NY and NJ have seen significant new increases as well.
What we have seen since the pandemic started is that, when it gets out of control, there is a pain threshold after which States take action – like enforcing mask-wearing and closing bars – and individuals get serious about limiting their exposure, that brings the rate of new infections down. A very good example is in the below graph, which tracks those States in the South which were at the epicenter of the summer outbreak:
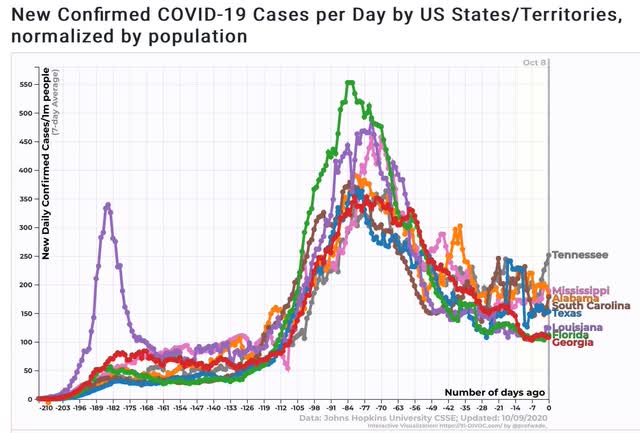
All of them (except Tennessee) have seen their rates of infection decline by more than 50% since then.
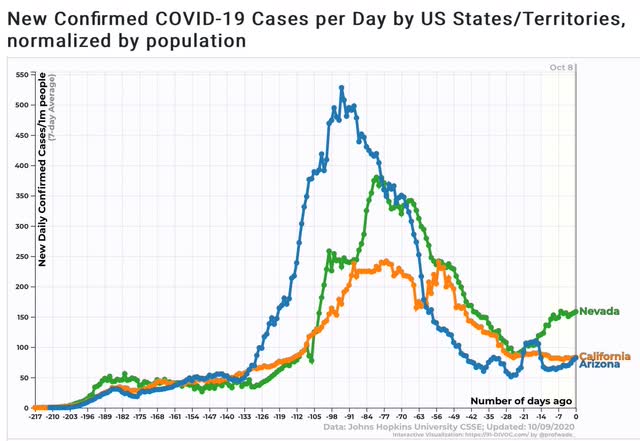
The same is true for Arizona, California, and Nevada in the West:
Meanwhile, States in the Upper Midwest and Mountain areas, which had very low infections rates during the first few months of the pandemic, were lax and have let their infection rates grow out of control:
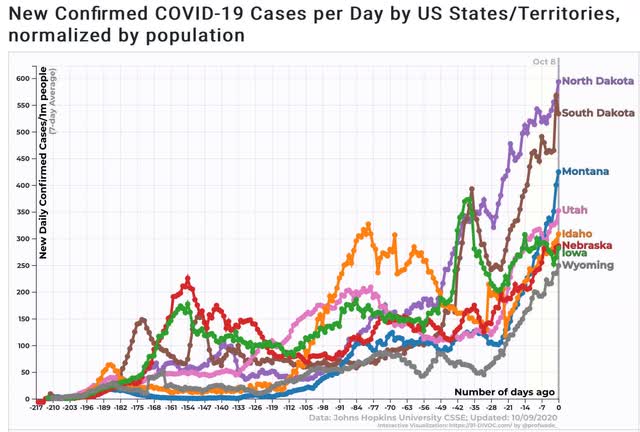
They are now reaching the pain threshold, so we can expect counter-measures to finally be enacted, or taken voluntarily by individuals, to stem the spread.
It seems that every State in every region has to learn the hard way. Getting lax leads to severe outbreaks, which leads to panic and vigilance – which ebbs over time in turn.