Via Economic Populist, rjs writes: Global oil output surplus was at 8.6 million barrels per day in May, despite OPEC cut of 6.3 million bpd Submitted by rjs on June 22, 2020 – 3:16pm Wednesday of this past week saw the release of OPEC’s June Oil Market Report, which covers OPEC & global oil data for May, and hence it gives us a picture of the global oil supply & demand situation during the first month of the two-month agreement between OPEC, the Russians, and other oil producers to cut production by 9.7 million barrels a day from an elevated October 2018 baseline. But before we review it, we have to caution that estimating oil demand while most countries on the planet are restarting their economies after a month or two of lockdown is pretty
Topics:
Dan Crawford considers the following as important: US/Global Economics
This could be interesting, too:
Joel Eissenberg writes How Tesla makes money
Angry Bear writes True pricing: effects on competition
Angry Bear writes The paradox of economic competition
Angry Bear writes USMAC Exempts Certain Items Coming out of Mexico and Canada
Via Economic Populist, rjs writes:
Global oil output surplus was at 8.6 million barrels per day in May, despite OPEC cut of 6.3 million bpd
Wednesday of this past week saw the release of OPEC’s June Oil Market Report, which covers OPEC & global oil data for May, and hence it gives us a picture of the global oil supply & demand situation during the first month of the two-month agreement between OPEC, the Russians, and other oil producers to cut production by 9.7 million barrels a day from an elevated October 2018 baseline. But before we review it, we have to caution that estimating oil demand while most countries on the planet are restarting their economies after a month or two of lockdown is pretty speculative, and hence the demand figures we’ll be reporting this month should be considered as having a much larger margin of error than we’d normally expect from this report…
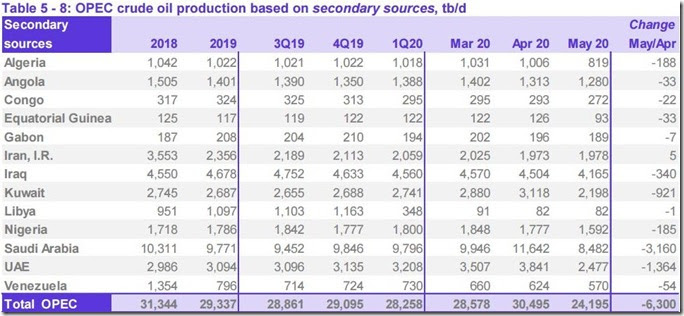
The first table from this monthly report that we’ll review is from the page numbered 44 of this month’s report (pdf page 54), and it shows oil production in thousands of barrels per day for each of the current OPEC members over the recent years, quarters and months, as the column headings indicate. For all their official production measurements, OPEC uses an average of estimates from six “secondary sources”, namely the International Energy Agency (IEA), the oil-pricing agencies Platts and Argus, the U.S. Energy Information Administration (EIA), the oil consultancy Cambridge Energy Research Associates (CERA) and the industry newsletter Petroleum Intelligence Weekly, as a means of impartially adjudicating whether their output quotas and production cuts are being met, to thus avert any potential disputes that could arise if each member reported their own figures…
As we can see from the above table of oil production data, OPEC’s oil output was cut by 6,300,000 barrels per day to 24,195,000 barrels per day during May, from their revised April production total of 30,495,000 barrels per day. However that April output figure was originally reported as 30,412,000 barrels per day, which means that OPEC’s April production was revised 83,000 barrels per day higher with this report, and hence May’s production was, in effect, a 6,213,000 barrel per day decrease from the previously reported OPEC production figures (for your reference, here is the table of the official April OPEC output figures as reported a month ago, before this month’s revisions)…
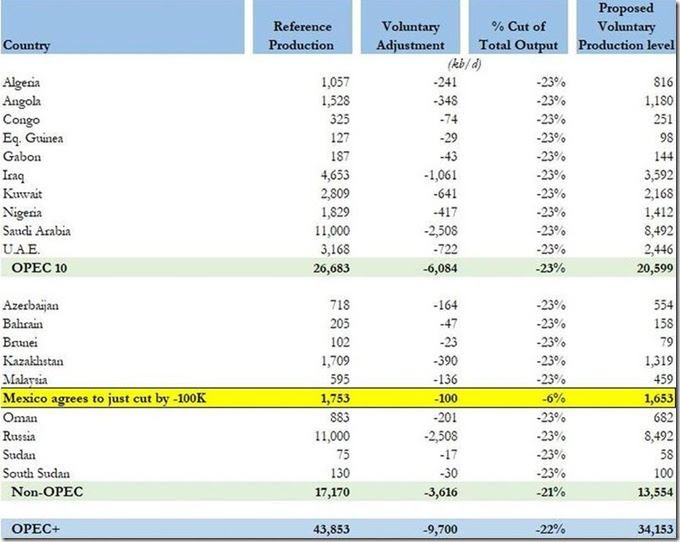
From the above table, we can also see that production decreases of 3,160,000 barrels per day from the Saudis, 1,364,000 barrels per day from the Emirates, 921,000 barrels per day from Kuwait, and 340,000 barrels per day from Iraq accounted for the lion’s share of the May decrease, even as every other OPEC producer except for Iran, whose production is exempt from the agreement, also made appropriate production cuts. To facilitate understanding how each of the OPEC members have been adhering to their production cut agreement, we’ll next include a table which shows the October 2018 reference production for each of the OPEC members (as well as other producers party to the mid-April agreement), as well as the production level each of those producers was expected to cut their output to….
The above table was taken from an article at Zero Hedge, and it shows the oil production baseline in thousands of barrel per day off of which each of the oil producers will cut from in the first column, a number which is based on each of the producer’s October 2018 output, ie., a date before the past year’s and past quarter’s output cuts took effect; the second column shows how much each participant will cut in thousands of barrel per day, which is 23% of the October 2018 baseline for all participants except for Mexico, while the last column shows the production level each participant has agreed to after that 23% cut. Sanctioned OPEC members Iran and Venezuela and war-torn Libya are exempt from these cuts…
With a net 6,300,000 barrels per day decrease in their production, it appears that OPEC has exceeded the 6,084,000 barrels per day they had committed to cut…however, the baseline for the May thru July cuts is OPEC’s production of October 2018, and the 6,300,000 barrels per day drop in their production represents the output change since April, so we can’t really compare the two. Moreover, production of some of the OPEC members is still well above their target level. For instance, Iraq had committed to cut their production by 1,061,000 barrels per day and only produce 3,592,000 barrels per day in May, but they only cut their production by 340,000 barrels per day in May, and thus produced 4,165,000 barrels per day, 572,000 barrels per day more than they were supposed to…
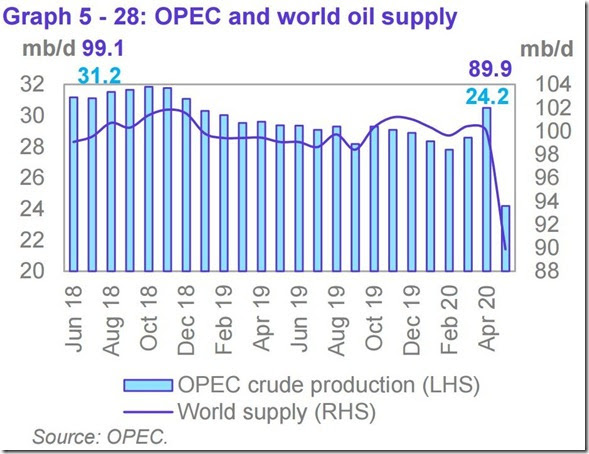
The the next graphic from this month’s report that we’ll include shows us both OPEC and world oil production monthly on the same graph, over the period from June 2018 to May 2020, and it comes from page 45 (pdf page 55) of the June OPEC Monthly Oil Market Report.. On this graph, the cerulean blue bars represent monthly OPEC oil production in millions of barrels per day as shown on the left scale, while the purple graph represents global oil production in millions of barrels per day, with the metrics for global output shown on the right scale….
Including the 6,300,000 barrel per day cut in OPEC’s production from what they produced a month earlier, OPEC’s preliminary estimate indicates that total global oil production decreased by a rounded 10.04 million barrels per day to average 89.89 million barrels per day in May, a reported decrease which apparently came after May ‘s total global output figure was revised lower by 470,000 barrels per day from the 99.46 million barrels per day of global oil output that was reported a month ago, as non-OPEC oil production fell by a rounded 3,740,000 barrels per day in May after that revision, with lower oil production from Russia, the US, Kazakhstan, Oman, Canada, Azerbaijan, Norway and Mexico the major reasons for the non-OPEC output decrease in May. With the big decrease in May’s global output, the 89.89 million barrels of oil per day produced globally in May were 8.2 million barrels per day, or 8.4% less than the revised 98.09 million barrels of oil per day that were being produced globally in May a year ago, the 5th month of OPECs first round of production cuts (see the June 2019 OPEC report (online pdf) for the originally reported May 2019 details). With this month’s big drop in OPEC’s output, their May oil production of 24,195,000 barrels per day fell to 26.9% of what was produced globally during the month, down from the 30.5% share OPEC contributed in April, and the 28.7% global share they had in March. OPEC’s May 2019 production, which included 529,000 barrels per day from former member Ecuador, was reported at 29,876,000 barrels per day, which means that the 13 OPEC members who were part of OPEC last year produced 5,152,000, or 17.6% fewer barrels per day of oil in May than what they produced a year ago, when they accounted for 30.4% of global output…
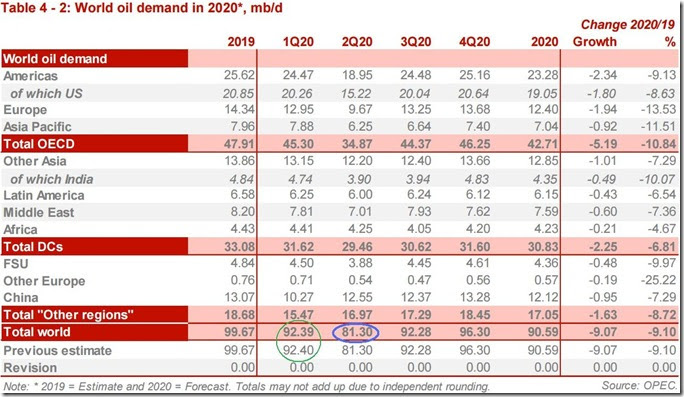
Even with the big drop in OPEC’s and global oil output that we’ve seen in this report, there was still a big surplus in the amount of oil being produced globally during the month, as this next table from the OPEC report will show us…
The above table came from page 25 of the June OPEC Monthly Oil Market Report (pdf page 35), and it shows regional and total oil demand estimates in millions of barrels per day for 2019 in the first column, and OPEC’s estimate of oil demand by region and globally quarterly over 2020 over the rest of the table…on the “Total world” line in the third column, we’ve circled in blue the figure that’s relevant for May, which is their estimate of global oil demand during the second quarter of 2020…
OPEC is estimating that during the 2nd quarter of this year, all oil consuming regions of the globe will be using an average of 81.30 million barrels of oil per day, unrevised from their estimate for the 2nd quarter a month ago, largely reflecting coronavirus related demand destruction….meanwhile, as OPEC showed us in the oil supply section of this report and the summary supply graph above, OPEC and the rest of the world’s oil producers were still producing 89.89 million barrels per day during May, which would imply that there was a surplus of around 8,590,000 barrels per day in global oil production in May, still 10.6% greater than the demand estimated for the month…
In addition to noting the May surplus, the downward revision of 470,000 barrels per day to April’s global output that’s implied in this report, means that the record 18,160,000 barrels per day of global oil surplus we had previously figured for April would now be revised to a surplus of 17,690,000 barrels per day. Since we had also figured a 18,068,000 barrels per day surplus in March, and since March supply & demand were unrevised in this report, that means the record oil surplus now occurred in March rather than in April. Although OPEC reports that their demand figure for the first quarter is unchanged from the last report, we note that the table shows that it fell from 92.40 million barrels per day to 92.39 million barrels per day, which we’ve lightly circled in green. Although that is essentially just a rounding difference, the 92.40 million barrels per day figure is the number we used to figure January’s and February’s surplus. Hence we should also revise our February surplus oil production estimate from 2,190,000 barrels per day to 2,180,000 barrels per day, and revise our January surplus oil production estimate from 1,220,000 barrels per day to 1,210,000 barrels per day..


