A macro view of how the 2020 Presidential election differs from 2016 This is a light week for economic data, so don’t be surprised if I take a break for a day or two. In the meantime, I wanted to post a few graphs that I think give a good “macro” view of the Presidential election this year, and how it is different from 2016. Aside from the fact that Trump now has a nearly 4 year record, and Presidential elections are usually a referendum on the incumbent President or party, the simple overriding fact is that Biden is viewed much more favorably, or perhaps much less *un*favorably, than Hillary Clinton was in 2016. To refresh your memory, here are a couple of graphs showing how (dis)liked both Trump and Hillary Clinton were in 2016: Both were
Topics:
NewDealdemocrat considers the following as important: politics
This could be interesting, too:
Robert Skidelsky writes Lord Skidelsky to ask His Majesty’s Government what is their policy with regard to the Ukraine war following the new policy of the government of the United States of America.
Joel Eissenberg writes No Invading Allies Act
Ken Melvin writes A Developed Taste
Bill Haskell writes The North American Automobile Industry Waits for Trump and the Gov. to Act
A macro view of how the 2020 Presidential election differs from 2016
This is a light week for economic data, so don’t be surprised if I take a break for a day or two.
In the meantime, I wanted to post a few graphs that I think give a good “macro” view of the Presidential election this year, and how it is different from 2016.
Aside from the fact that Trump now has a nearly 4 year record, and Presidential elections are usually a referendum on the incumbent President or party, the simple overriding fact is that Biden is viewed much more favorably, or perhaps much less *un*favorably, than Hillary Clinton was in 2016.
To refresh your memory, here are a couple of graphs showing how (dis)liked both Trump and Hillary Clinton were in 2016:
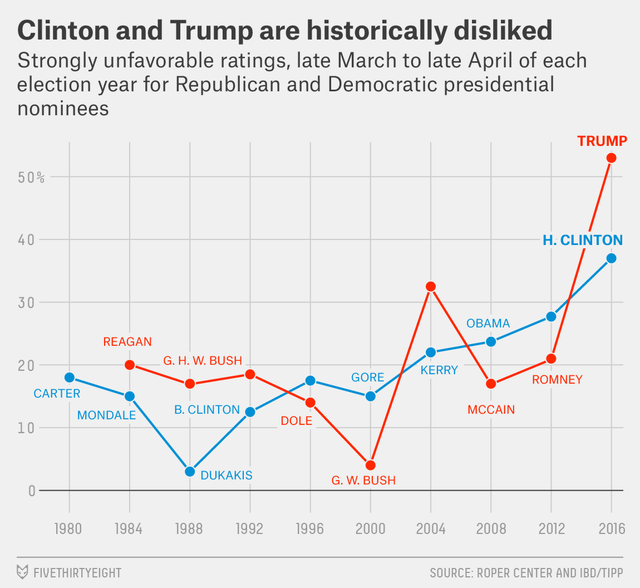
Both were historically more disliked than any other previous candidate of either party. Almost 50% of likely voters *strongly* disliked her, and majority did dislike her:

NOTE IMPORTANTLY: I am not making a value judgment that Hillary Clinton was dislike*able*. I am simply reporting that she was in fact historically disliked. When right in the middle of ongoing early voting, Comey insinuated that she might be a crook, that’s all it took to give Trump his inside straight win in the Electoral College.
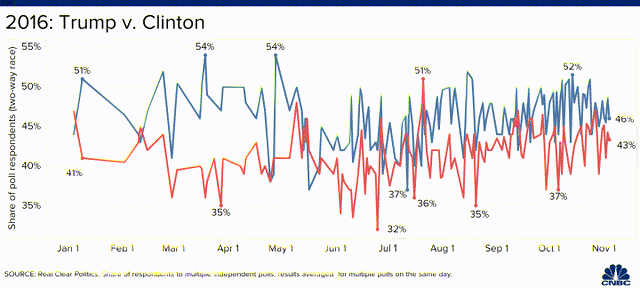
Note that there were several brief periods where Trump actually led.
Here’s a smoothed out view of the year:
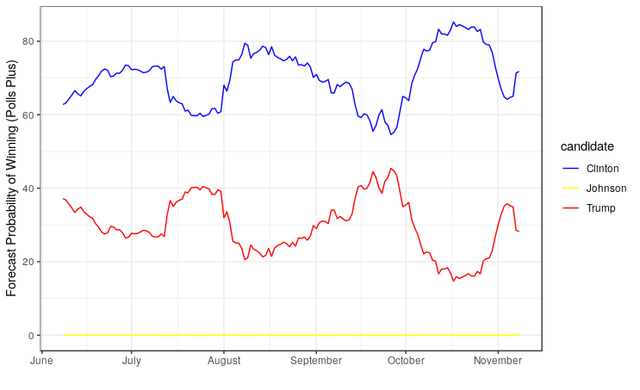
And here is the forecast probability of winning:
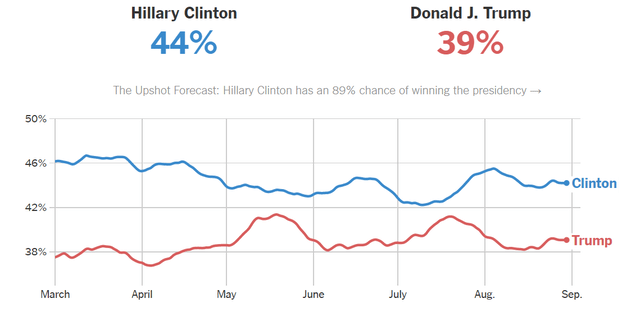
As I said above, there were wide swings in the race.
Before I go further, let me add into the mix this graph of the average deviation in polls depending on the time to the election:
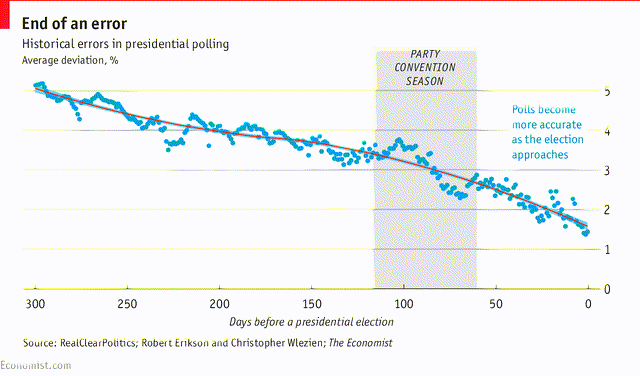
Now let’s compare that with 2020 so far. Here’s Nate Silver’s summary of national polling for the past 6 months:
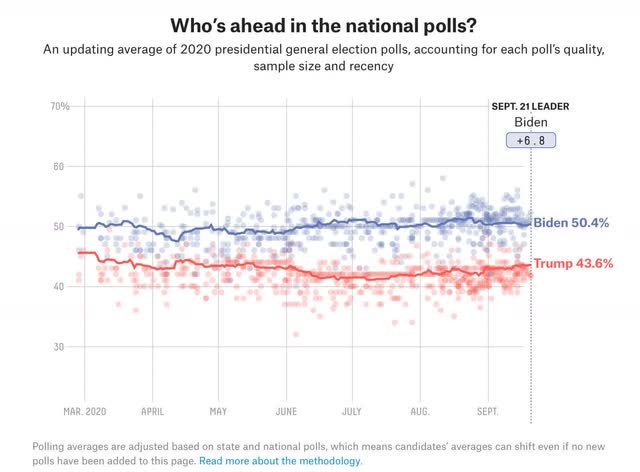
This has been a remarkably steady race for months on end. Even when Trump got the most benefit from his brief “rally round the flag” moment in early April, he still trailed Biden by 3.5%, 44.1% to 47.6%. For the past month, Biden has polled very close to 50% in either direction consistently.
In short, there’s every reason to believe that the polling this year is closer to the ultimate result than has historically been the case. I’m not even sure the thermonuclear bomb of Justice Ginsburg’s death is going to have much of an effect on the polling; at most I suspect it will increase the population of likely voters.
