Three related metrics of coronavirus Here are three different but ultimately related updates about the coronavirus pandemic. 1. It is 100x more lethal than the 2009 H1N1 swine flu The latest right-wing disinformation is that Obama waited 6 months to declare the 2009 swine flu an emergency, and 1000 people died. As others have pointed out, his Secretary of Health and Human Services did so only 11 days into the US outbreak. So why don’t we remember a big health emergency in 2009? Because the swine flu was 100x less lethal than coronavirus. According to the CDC’s final estimates: from April 12, 2009 to April 10, 2010 approximately 60.8 million cases (range: 43.3-89.3 million), 274,304 hospitalizations (195,086-402,719), and 12,469 deaths (8868-18,306)
Topics:
NewDealdemocrat considers the following as important: Healthcare
This could be interesting, too:
Bill Haskell writes Families Struggle Paying for Child Care While Working
Joel Eissenberg writes RFK Jr. blames the victims
Joel Eissenberg writes The branding of Medicaid
Bill Haskell writes Why Healthcare Costs So Much . . .
Three related metrics of coronavirus
Here are three different but ultimately related updates about the coronavirus pandemic.
1. It is 100x more lethal than the 2009 H1N1 swine flu
The latest right-wing disinformation is that Obama waited 6 months to declare the 2009 swine flu an emergency, and 1000 people died. As others have pointed out, his Secretary of Health and Human Services did so only 11 days into the US outbreak.
So why don’t we remember a big health emergency in 2009? Because the swine flu was 100x less lethal than coronavirus. According to the CDC’s final estimates:
from April 12, 2009 to April 10, 2010 approximately 60.8 million cases (range: 43.3-89.3 million), 274,304 hospitalizations (195,086-402,719), and 12,469 deaths (8868-18,306) occurred in the United States [were] due to pH1N1.
That is a mortality rate of 0.02%, or 2 in 10,000. The total number of deaths, spread out over a year, were 10% of average seasonal influenza deaths.
By contrast, coronavirus appears to have a 2% (some estimates are coming in more like 3%) mortality rate. If 60.8 million Americans were to contract coronavirus, that would mean about 1,200,000 deaths.
2. Exponential projections of the spread of the virus are holding up so far.
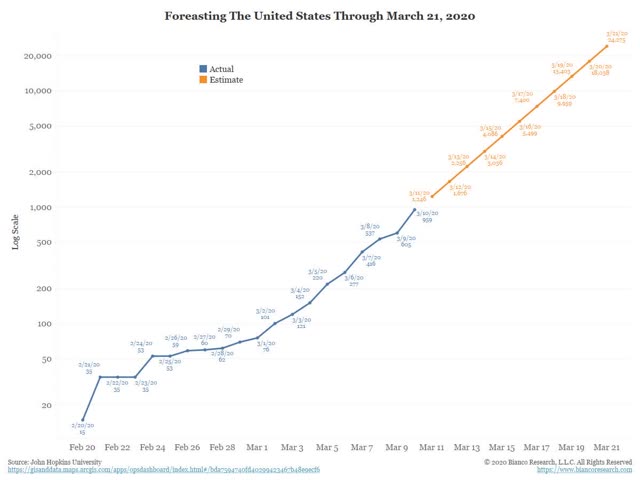
Two days ago, Jim Bianco of Bianco Research posted the following linear projection of coronavirus infections for the next 10 days if they continued to increase at an exponential rate:
For the first two days of that projection, his numbers have not only been close to accurate, they have actually been slightly low:
March 11 projection: 1246 actual: 1300+
>March 12 projection: 1676 actual: 1700+
At the current rate, we will have more than 10,000 cases only 4 days from now.
3. The stock market’s big declines can be seen as reactions to rational projections of exponentially increasing impacts with each passing day.
Take Bianco’s graph above, and project 7 days in advance, as in each passing day the federal government fails to do what is necessary to get in front of the pandemic. Each such day means not just an increased impact, but an increasing *rate* of those economic impacts.
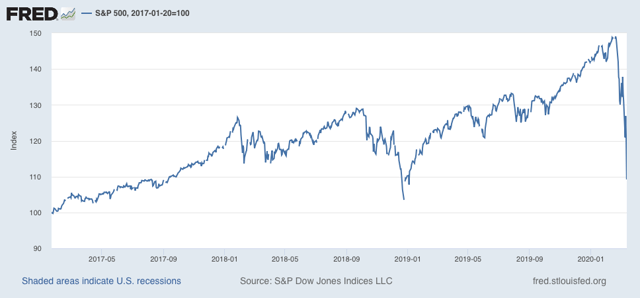
Since the date of Donald Trump’s inauguration, as of this morning the market is only up 9.2%:
This does not mean that the market will continue to fall in a straight line, or ad infinitum.
But if I had to guess, it would be that the ultimate bottom will take place once the market senses that adequate steps have been taken to contain the outbreak, even if that means the entire economy shuts down for 2 or 3 weeks.


