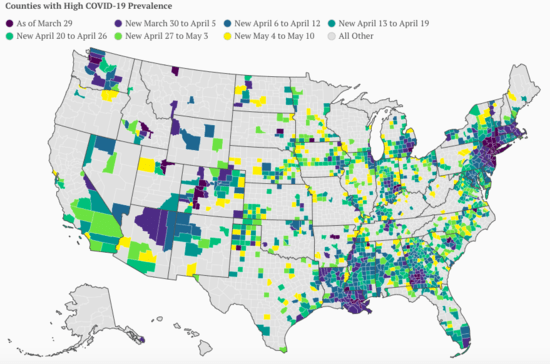
Updating the Petri dishes of democracy: population density remains a primary determinant of intensity Over the weekend I saw a map indicating that new coronavirus infections have been increasing on a relative basis in different and generally more rural parts of the country, especially in the Baltimore-Washington portion of the eastern megalopolis and the “black belt” in the South, the interior Midwest and Mountain West: Below are two charts consisting of the 12 most and least densely populated States, their respective population densities, and several measures of coronavirus infections. The first column gives the rank of the State based on the total number of infections recorded since the start of the pandemic. The second column gives their rank
Topics:
NewDealdemocrat considers the following as important: Healthcare
This could be interesting, too:
Bill Haskell writes Families Struggle Paying for Child Care While Working
Joel Eissenberg writes RFK Jr. blames the victims
Joel Eissenberg writes The branding of Medicaid
Bill Haskell writes Why Healthcare Costs So Much . . .
Updating the Petri dishes of democracy: population density remains a primary determinant of intensity
Over the weekend I saw a map indicating that new coronavirus infections have been increasing on a relative basis in different and generally more rural parts of the country, especially in the Baltimore-Washington portion of the eastern megalopolis and the “black belt” in the South, the interior Midwest and Mountain West:

Below are two charts consisting of the 12 most and least densely populated States, their respective population densities, and several measures of coronavirus infections.
The first column gives the rank of the State based on the total number of infections recorded since the start of the pandemic. The second column gives their rank per capita over time since the start of the pandemic. Finally, the third column gives their rank per capita based on infections (in parentheses) in the week before my original look at this (May 1-8), compared with the past week:
| State | Population Density (Per Sq. Mile) |
Total # Infections (Rank) |
Infections Per capita (Rank) |
1 week Infections Per capita |
|---|---|---|---|---|
| NJ | 1208 | 2 | 2 | (2)8 |
| RI | 1010 | 23 | 4 | (1)1 |
| MA | 867 | 4 | 3 | (3)4 |
| CT | 741 | 12 | 5 | (6)7 |
| MD | 614 | 10 | 9 | (8)6 |
| DE | 484 | 33 | 6 | (9)2 |
| NY | 419 | 1 | 1 | (7)10 |
| FL | 376 | 9 | 32 | (37)37 |
| PA | 286 | 6 | 11 | (14)18 |
| OH | 284 | 15 | 28 | (26)31 |
| CA | 251 | 5 | 33 | (31)33 |
| IL | 231 | 3 | 7 | (5)3 |
| State | Population Density (Sq. Mile) |
Total # Infections (Rank) |
Infections Per capita (Rank) |
1 week Infections Per capita |
|---|---|---|---|---|
| OR | 42 | 40 | 47 | (45)45 |
| UT | 36 | 34 | 30 | (29)34 |
| KS | 36 | 31 | 21 | (11)26 |
| NV | 26 | 35 | 29 | (35)36 |
| NE | 25 | 29 | 10 | (4)5 |
| ID | 20 | 42 | 42 | (44)44 |
| NM | 17 | 36 | 20 | (19)19 |
| SD | 11 | 39 | 12 | (23)13 |
| ND | 11 | 43 | 25 | (25)20 |
| MT | 7 | 49 | 50 | (50)49 |
| WY | 6 | 47 | 44 | (41)43 |
| AK | 1 | 50 | 48 | (48)48 |
Among the most sparsely populated States, five are ranked in the top half of States in infections per capita since the outset of the pandemic (Kansas, Nebraska, New Mexico, North and South Dakota). Nebraska and South Dakota in particular have very poor records.
