The NIAID Trial of Remdesivir has closed early, because they concluded it was not ethical to treat people with placebo given what they consider proof that Remdesivir is effective. This is huge news (I am surprised that the Dow Jones only went up 2% not that I care about the Dow Jones). This is a large double blind randomized controlled trial. The null of no effectiveness was rejected using the principal outcome measure. This is the sort of outcome which causes the FDA to approve drugs. The data shows that remdesivir has a clear-cut, significant, positive effect in diminishing the time to recovery,” said the institute’s director, Dr. Anthony Fauci.Results from the preliminary trial show remdesivir improved recovery time for coronavirus patients from 15 to
Topics:
Robert Waldmann considers the following as important: Healthcare
This could be interesting, too:
Bill Haskell writes Families Struggle Paying for Child Care While Working
Joel Eissenberg writes RFK Jr. blames the victims
Joel Eissenberg writes The branding of Medicaid
Bill Haskell writes Why Healthcare Costs So Much . . .
The NIAID Trial of Remdesivir has closed early, because they concluded it was not ethical to treat people with placebo given what they consider proof that Remdesivir is effective. This is huge news (I am surprised that the Dow Jones only went up 2% not that I care about the Dow Jones).
This is a large double blind randomized controlled trial. The null of no effectiveness was rejected using the principal outcome measure. This is the sort of outcome which causes the FDA to approve drugs.
The data shows that remdesivir has a clear-cut, significant, positive effect in diminishing the time to recovery,” said the institute’s director, Dr. Anthony Fauci.Results from the preliminary trial show remdesivir improved recovery time for coronavirus patients from 15 to 11 days.
Also preliminary results from the Gilead 5 days vs 10 days study were announced. This is an odd study as there was no control group. The result is that the null that 5 days of treatment are as good as 10 days of treatment was not rejected. This is very useful information, since Remdesivir is likely to be a lot of excess demand for Remdesivir very soon. Many wondered why do a study without a control group. I think the aim was to get Remdesivir in as many people as possible as soon as possible. The study has 6,000 participants. This is in addition to the controlled trials, the expanded access program and individuals who have obtained compassionate use.
The scientific result is not critical. If Remdesivir doesn’t work, the 5 days are as good as 10 days and no one cares as 0 days are also just as good at 0 cost and with 0 side effects. However managers at Gilead believed (with it appears good reason) that the cost of the trial is huge and negative. Certainly people beg to participate. I think that in extreme cases it can be a good idea to use drugs based on preliminary (even in vitro) evidence while waiting for the results of the phase III controlled trial. The Gildead 5 day v 10 day trial is one example of this, and I applaud their clever approach to dealing with regulations.
Also, last and least, the disappointing Chinese study has been published in The Lancet. This is the study which caused widespread dismay and headlines including “Remdesivir fails”. Given the results of the NIAID trial, it appears that some people misunderstood the brief note accidentally published by WHO. More people correctly asserted that the question was still open. However, I think misunderstanding of the note (maybe also by the person who wrote it) is a good example of what happens when people try to use mathematical statistics but do not understand the Neyman Pearson framework, that is don’t know what a null hypothesis means or what failure to reject a null hypothesis implies. This is a very common elementary error (actually more universal than common).
I am not going to provide links, but many articles and especially many headlines contained the completely incorrect claim that the study showed that Remdesivir failed to perform better than a placebo. This is simply and obviously false (this is obvious without looking at the data just based on an understanding of what data can and can not imply). The correct statements are that the Chinese trial failed to show that Remdesivir performed better than a placebo or (equivalently) that Remdesivir failed to perform statistically significantly better than a placebo.
Removing the words “statistically significantly” makes a true statement absolutely false. It is not acceptable even in a headline.
In fact, in the study, on average patients treated with Remdesivir recovered more quickly than patients treated with placebo, however, the difference was not large enough to reject the null of no benefit at the 5% level. the ratio was not huge with a ratio of hazards of improvement of 1.2. Notably the ratio 1.31 in the NIAID trial is not huge either. The difference between headline success and headline failure is almost entirely due to the sample size. This is a failure to understand what it means to test a null hypothesis against and alternative hypothesis. The statement that the Chinese study was underpowered does not even begin to approach a demonstration of an understanding of elementary mathematical statistics. I will try to explain after the jump.
An even more alarming headline result of the Chinese study was that Remdesivir did not have a statistically significantly greater effect on the viral load. The failure to help patients statistically significantly more could occur even if Remdesivir blocked viral replication in people as it does in vitro. The explanation is that late in the disease the often fatal trouble is due to the patients’ immune response not the virus directly. Cytokine storm can kill in the absence of a virus.
However, a failure to reduce the viral load would be terrible news. Of course the study didn’t show that. It showed that the reduction was not statistically singnificant not that it was zero. Now there are two ways to compare treaments — the viral load after days of treatment or the reduction of the viral load from when treatment started. In principle and with large enough samples, this makes little difference. The two treatments are randomized and the average viral load at the beginning of the trial for the two treatments will go to the same number by the law of large numbers, which is true asymptotically (recall my personal slogan “asymptotically we’ll all be dead”). It did not apply in this case.
The average lower respiratory viral load (from now on just viral load) at the beginning of the trial was not similar for those treated with Remdesivir and those treated with placebo. It was roughly 10 time higher for those treated with Remdesivir. Notice the recovered more quickly in spite of having an initial viral load on average 10 times higher.
In this case it seems reasonable to look at each patients viral load after n days of treatment divided by his or her viral load aftr 0 days of treatment. The FDA will not allow doing what seems reasonable after looking at the data (nor should they). To avoid cherry picking the test must be described *before* the data are collected. I think that, reasonably assuming the distributions of initial loads would be similar for the two groups, the researchers said they would look a viral load on day n not that ratio, so the placebo started out with (on average) a huge head start.
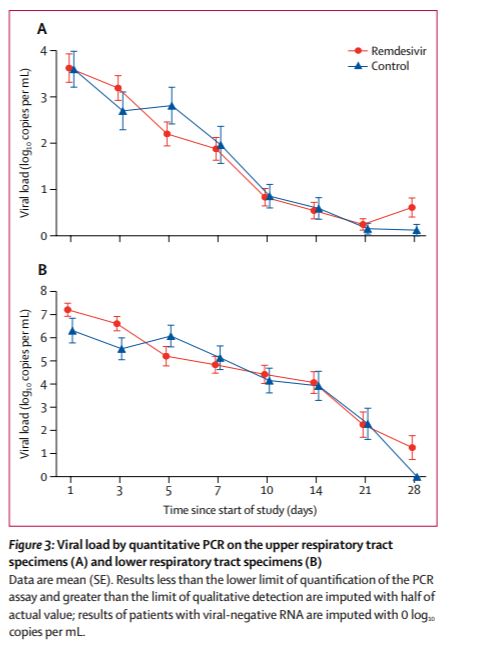 Also Remdesivir caught up. After 2 days of treatment, the average viral load was lower in remdesivir treated patients. The ratio changed (roughly eyeballing) 100 fold. This is the raw data which was reported as Remdesivir fails to reduce the viral load.
The authors tested if this (apparently huge difference but I am cherry picking after 2 days) was statistically significant and got a p level of 0.0672. This means that, even if allowed to divide by initial levels, they would not have rejected the null of no benefit at the 5% level. It would have been reported as “remdesivir failed to affect the viral load”. This is would have been crazy.
I think the particular issue of divide by initial load or not is less important than the point that a p level of 0.0672 is not the same as a p level of 0.5, yet it is treated as the same.
5% is not a scientific concept. Calling 5% statistically signficant is an arbitrary choice due to the fact that the (smallest) 95% interval of a normal distribution is about 4 standard deviations. The idea that science requires one to look only at whether an number is greater or less than 0.05 is crazy and extremely influential.
The correct brief description of the results of the Chinese study is that, in the study, patients on Remdesivir did better than patients on placebo, but the difference was not significant at the 5% level. The direction the results points depends on the point estimate. Technicalities like p values are also important as are technicalities like the power function. But considering p values the main result and power a technicality is an error. It lead people to conclude that a ratio which was 100 after 2 days of treatment had been shown to be constant at 1.
I should point out that everything I am writing about hypothesis testing is elementary statistics which statisticians try again and again and again to explain.
After the jump I wonder why and type more about statistics.
So why do people do this ?
1) people have overlearned the fact that people draw too firm conclusions from small amounts of data. I have read a lot about rigorous science, not drawing a conclusion based on anecdotal evidence, not allowing anything but the results of controlled trials (after peer review and criticism) to influence the practice of medicine etc etc etc. Having seen the same error again and again and again, it is natural for people to decide that one can’t be too cautious. Also, as is relevant in this case, that one can be cautious. Better safe than sorry makes sense if one can choose safety, but the discussion was of treatment of Covid 19.
2) Serious people are pessimistic, because serious people have to tell unpleasant truths. We want to believe that there is a cure for Covid 19, so serious people don’t give in to there wishes, but rather overcorrect
3) The FDA. I think that the Pure Food and Drug act has influenced perceptions of the scientific method (I really seriously think this). One thing I have learned googling remdesivir (last hour) again and again is a whole lot of commentary comes from market analysts. I think more than half of the posts on this very important issue addressed the very unimportant question of what the Gilead share price would be in the near future. For investors (or Gilead employees including managers) what matters is whether the results will cause FDA approval or not (and whether they will make it more difficult to convince the FDA with another trial). Here the burden of proof is on the hypothesis that pharmaceutical works, because that’s the law (as interpreted by the FDA). I am quite sure that this is internalized by researchers. They must accept the power of the FDA, it does no good to question the FDA’s decisions and rules, the habit of considering what will satisfy the FDA makes researchers come to think that that which the FDA neglects is negligible. I do not have first hand experience, but I have a whole lot of second hand experience.
OK so I will try to explain hypothesis testing. The embarrassing thing is that a lot of it rests on the Neyman Pearson lemma which considers the absurdly simple special case for which there are closed form solutions and there is the one clearly right way to test a hypothesis.
I blush to type that it is the case of testing a point null hypothesis against a point alternative hypotheis. Ho is that the data are distributed according to distribution function 1 and Halt that they are distributed according to distribution function 2. This is hardly ever done. It is much more common that the null is a set of distributions and the alternative is another (usually higher dimensional) set. Often both sets are parametrized, that is the different elements are described by a vector of numbers (usually even finite dimensional). Very often the null hypothesis is that some function of the parameters of the true distribution is equal to zero. Also often the alternative is that it is not equal to zero. I don’t want to talk about this problem. It’s really too hard. There are different valid ways to test such a null against such an alternative. Often one rejects the null and the other doesn’t. What to do is an unsolved problem in statistics.
So let’s stick to the solved problem. Are the data generated by distribution 1 or distribution 2 ? One way to look at this is to call distribution 1 the null and ask if it is rejected against the alternative that the data are generated by distribution 2. Another, obviously equally valid thing to do is to call distribution 2 the null and ask if it is rejected against the alternative that the data are generation by distribution 1. Which is the null and which is the alternative is a completely arbitrary choice. Any assertion that the alternative should bear the burden of proof must be incorrect. Only people who don’t know the first thing about hypothesis testing (as typed above) can make such a mistake.
To go on. the way to test the null is to look at the likelihood of the observed data if the data have distribution 1 and if the data have distribution 2, then look at the ratio of those likelihoods. This is the test which gives the greatest power given size, (the greatest sensitivity given specificity, the least type II error for a given level of type 1 error etc).
This also means there is no clearly best test if the alternative is a set of distributions with more than one element (that’s the Neyman Pearson theorem).
The likelihood ratio (likelihood2/likilihood1) needed to reject distribution 1 against distribution 2 at, say for example the 6.8% level is greater than 1. This is also true for the equally 5% level. let’s pretend we have an example in which the critical level of the ratio is 2 (the critical level depends on exactly what distribution 1 and distribution 2 are).
Clearly the data provide support for 2 against 1 if the ratio is greater than 1. If the ratio is 1.9 then the data support 2 over 1, the null hypothesis 1 is not rejected at the 5% level against the alternative hypothesis 2and the null hypothesis 2 is not rejected against the alternative hypothesis 1.
The headlines might say that the data show that 2 is false, or that the data suggest that 2 is false, but we should consider power. Both statements are nonsense. There are have been many many such headlines recently.