Further considerations on the disappointing April jobs report. Consider the averages! I’ve been threatening for a couple of weeks to run some extended comments on the big miss in the April jobs report. As there’s no economic news of note today, here goes . . . . 1. It’s possible March was the outlier rather than April. The original report for March was that 916,000 jobs were added. In this month’s report it was revised down to 770,000. Below is a graph of “civilian employment” from the household report (blue), “employment” from the establishment report (which is the commonly reported number (red), and the monthly change in initial jobless claims (green, inverted so that a decline shows as a positive, /100 for scale): Note that in
Topics:
NewDealdemocrat considers the following as important: April jobs report, Taxes/regulation, US EConomics
This could be interesting, too:
NewDealdemocrat writes JOLTS revisions from Yesterday’s Report
Bill Haskell writes The North American Automobile Industry Waits for Trump and the Gov. to Act
Bill Haskell writes Families Struggle Paying for Child Care While Working
Joel Eissenberg writes Time for Senate Dems to stand up against Trump/Musk
Further considerations on the disappointing April jobs report. Consider the averages!
I’ve been threatening for a couple of weeks to run some extended comments on the big miss in the April jobs report. As there’s no economic news of note today, here goes . . . .
1. It’s possible March was the outlier rather than April.
The original report for March was that 916,000 jobs were added. In this month’s report it was revised down to 770,000. Below is a graph of “civilian employment” from the household report (blue), “employment” from the establishment report (which is the commonly reported number (red), and the monthly change in initial jobless claims (green, inverted so that a decline shows as a positive, /100 for scale):
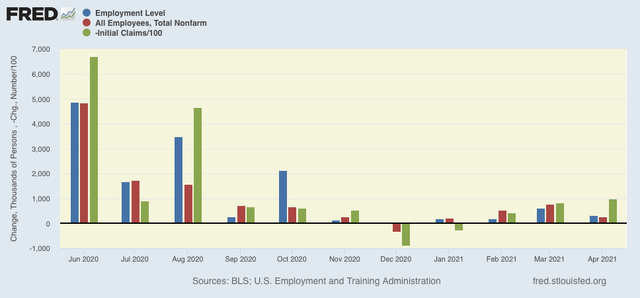
Note that in general – but not always! – the change in jobless claims correlates well with the change in both of the jobs numbers. Note also that the April change in jobless claims was the largest since early on in the pandemic.
That being said, there have been *only* about a dozen previous times in the last 50+ years when initial claims declined as much as they did in April, but before the pandemic, the median change was about +350,000 for such changes. That’s a very small sample, so a large variance can easily be expected.
In any event, the 2-month change for March and April in the jobs report was +1,036,000 as currently revised or 518,000/month. The comparable “civilian employment” 2-month number from the household survey was 937,000, or 468,500/month. The household report # now looks very close to the establishment survey’s number. In other words, the original establishment report of 916,000 for March may have been the outlier, and maybe we should have expected #s closer to the 350,000 median that was correlated with similar improvement in the jobless claims numbers.
2. But the likelihood of big job gains isn’t over – and maybe missed by the establishment survey
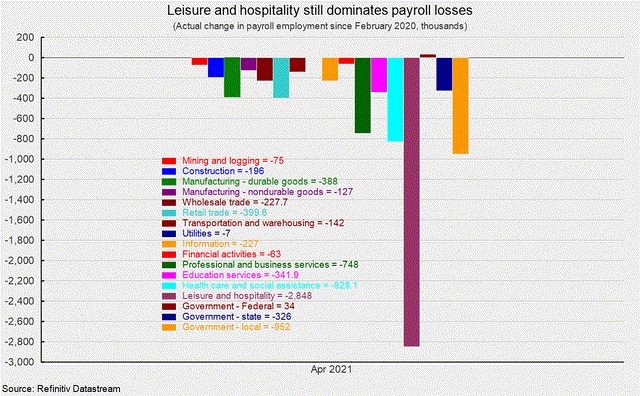
There are still a ton of closed businesses and laid off employees out there. Fortunately, I’ve been saved the intensive work of sorting out those losses by jobs categories, because it’s already been done by the American Institute of Economic Research, which produced the below two graphs, first of the raw numbers of current pandemic job losses in each sector:
And the same expressed as a percentage of pre-pandemic jobs:
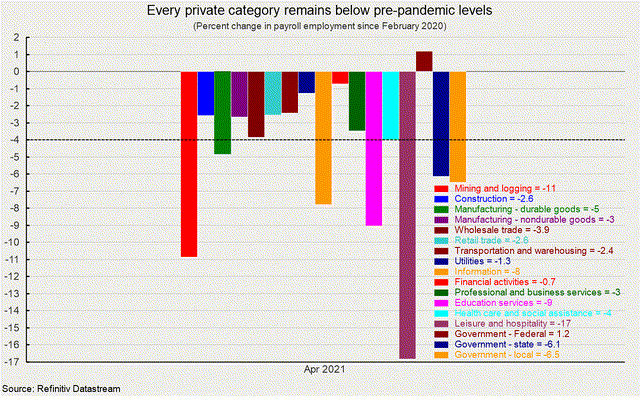
In leisure and hospitality in particular, there remain almost 3,000,000 lost jobs, or nearly 20% of the pre-pandemic total in that sector. There are also large losses in local government, professional and business services, and social assistance.
Once the US reaches herd immunity, which I believe will be sometime this summer, I would expect most of those positions to open back up. Which means more big employment gains.
Also, anecdotally, I was in a neighboring metro with some friends last weekend, and we came across the site of one of our favorite restaurants that had “permanently” closed last spring as the pandemic lockdowns hit. And – surprise! – it had just opened back up in the same location. I wonder how many other landlords and former tenants are making similar arrangements? If this is happening a lot, the only way it would show up in the establishment jobs report is via the “birth/death adjustment” which estimates how many new businesses have just opened, and haven’t been around long enough to be picked up by the survey. If this adjustment is off in these nearly unprecedented times, then the only place we might see these jobs being picked up is in the household report, where people report whether or not they have jobs.
3. The best evidence is that enhanced unemployment benefits have not been a big drag on hiring.
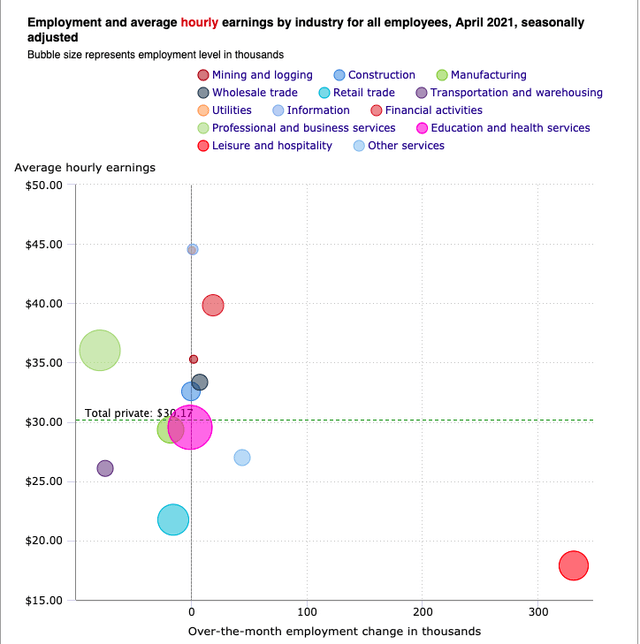
Two separate sources took a look at where the big job gains were (and weren’t) in the April report, separated out by where those jobs typically fit on the wage scale.
If enhanced unemployment benefits were the big driver of the disappointing report, then we would expect the impact to show up most in low-paying jobs.
It didn’t. Here is a dot-plot:
And here is an easier-to-interpret line graph, with labels:
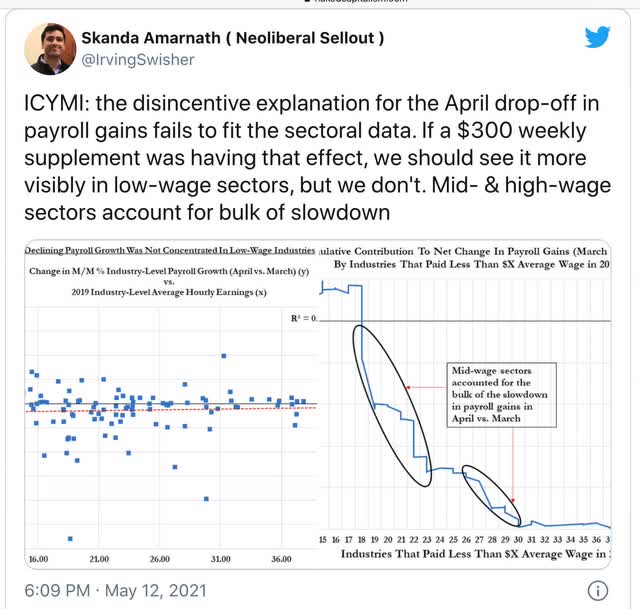
The conclusion in both is that mid-level wage jobs were the source of the big slowdown. That’s not due to $300 added jobless benefits!
So, my considered best guess is, discount the blockbuster March report more than the relatively tepid April report, average the gains in the two months out, don’t fret about enhanced unemployment benefits, and don’t assume that the time of big job gains is over.
