Final existing home sales report of 2021 is positive As we wind down the year, most of the remaining data will be from the housing sector. Tomorrow we get new home sales, then next week one final round of house price indexes. Two months ago I wrote that “I suspect new home sales will increase, since interest rates stabilized at very low rates earlier this year, and the increase in existing home sales is some confirmatory evidence.” Since then, sales increased in October by 0.8%, and today existing home sales for November were reported, and the news continued positive, as sales increased another 1.9%, from 6,340,000 annualized to 6,460,000. This is the highest number since January of this year, and aside from the period from September last year
Topics:
NewDealdemocrat considers the following as important: existing home sales, US EConomics
This could be interesting, too:
NewDealdemocrat writes JOLTS revisions from Yesterday’s Report
Bill Haskell writes The North American Automobile Industry Waits for Trump and the Gov. to Act
Bill Haskell writes Families Struggle Paying for Child Care While Working
Joel Eissenberg writes Time for Senate Dems to stand up against Trump/Musk
Final existing home sales report of 2021 is positive
As we wind down the year, most of the remaining data will be from the housing sector. Tomorrow we get new home sales, then next week one final round of house price indexes.
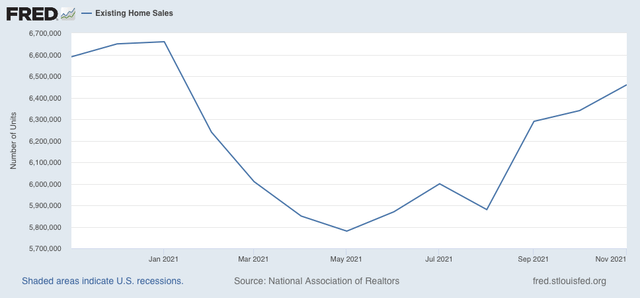
Two months ago I wrote that “I suspect new home sales will increase, since interest rates stabilized at very low rates earlier this year, and the increase in existing home sales is some confirmatory evidence.” Since then, sales increased in October by 0.8%, and today existing home sales for November were reported, and the news continued positive, as sales increased another 1.9%, from 6,340,000 annualized to 6,460,000. This is the highest number since January of this year, and aside from the period from September last year through January, the highest since 2007 (note the NAR only permits FRED to publish the last year of numbers:

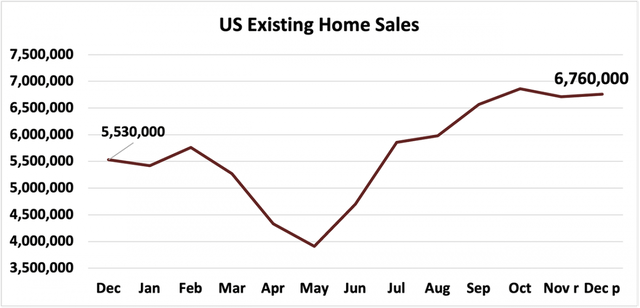
Here is the graph from exactly one year ago, covering 2020:

As CNBC said at the time, “Pandemic-driven demand sent total 2020 home sales to the highest level since 2006.”
On a YoY basis, sales are only down 2%, the best comparison in months.
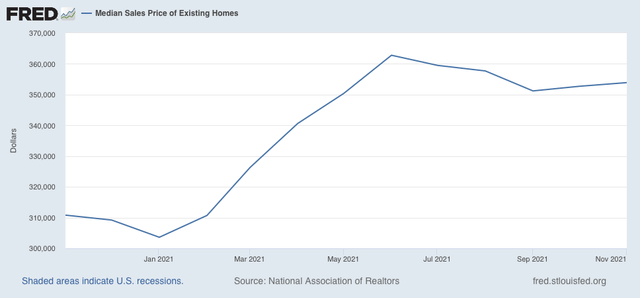
Median prices of existing homes are not seasonally adjusted. On a YoY basis, they were up 13.9%:

Since the “the cure for high prices is, high prices,” I have been tracking YoY median price gains over the last 6 months:
Jun +23% (YoY high)
Jul +20%
Aug +15%
Sep +13%
Oct +13%
Nov +14%
While these are not seasonally adjusted either, my rule of thumb is that a deceleration of 50% typically marks the top for any such statistic. Since we have stabilized at above 12.5%, this is evidence that, on a seasonally adjusted basis, prices have continued to increase, although at a less dizzying pace.
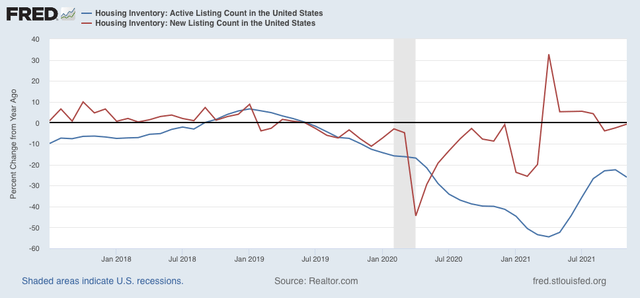
Finally, Realtor.com does provide FRED with both new and total (“active”) listing counts for the past 5+ years. Since these are also not seasonally adjusted, here is the YoY look at both:

New listings declined precipitously in late 2019 even before the pandemic – and the pandemic certainly hasn’t helped. But new listings have almost completely recovered YoY, now down less than -1% since last November; while total listings have continued to decline, albeit less precipitously.
This is not a market that is about to roll over. I suspect new inventory will go positive YoY shortly, and price gains will moderate, although not disappear. If new home sales similarly advance tomorrow, that will augur well for 2022.
