House prices continue to surge, with affordability near its worst since the Great Recession The FHFA and Case Shiller house price indexes for May and April, respectively, were released this morning. Because housing affordability is very much an issue, let’s take a look. YoY the FHFA index is up 15.7%, and the Case Shiller national index is up 13.9%: Not shown, but recall that last week the median price for new single-family homes was reported up 18.1% YoY for May, and for existing homes up 23.6% YoY. This is on par with their most drastic increases during the housing bubble.A quick estimate of how (un-)affordable housing is can be seen by dividing house prices by average hourly wages, i.e., how many hours of income does it cost to buy
Topics:
NewDealdemocrat considers the following as important: Housing Prices, US EConomics
This could be interesting, too:
NewDealdemocrat writes JOLTS revisions from Yesterday’s Report
Bill Haskell writes The North American Automobile Industry Waits for Trump and the Gov. to Act
Bill Haskell writes Families Struggle Paying for Child Care While Working
Joel Eissenberg writes Time for Senate Dems to stand up against Trump/Musk
House prices continue to surge, with affordability near its worst since the Great Recession
The FHFA and Case Shiller house price indexes for May and April, respectively, were released this morning. Because housing affordability is very much an issue, let’s take a look.
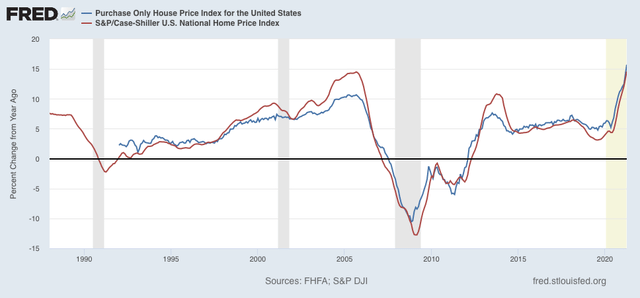
YoY the FHFA index is up 15.7%, and the Case Shiller national index is up 13.9%:

Not shown, but recall that last week the median price for new single-family homes was reported up 18.1% YoY for May, and for existing homes up 23.6% YoY. This is on par with their most drastic increases during the housing bubble.
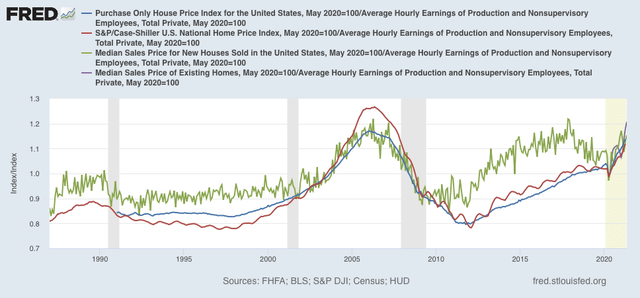
A quick estimate of how (un-)affordable housing is can be seen by dividing house prices by average hourly wages, i.e., how many hours of income does it cost to buy a typical house. Here’s a long term view of what all 4 indexes looked like normed to 1 as of May 2020:

Note that existing home prices are only available to FRED from the NAR for the past 12 months. But it is quite clear that “real” wage-adjusted house prices are close to their most extreme measures during the bubble.
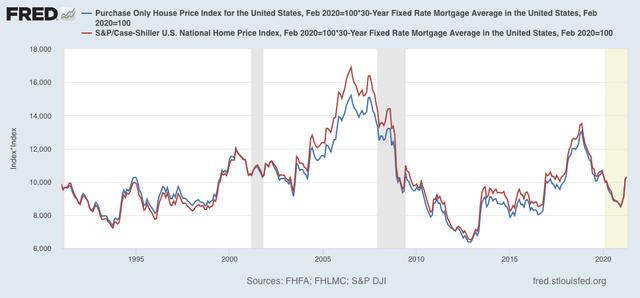
Another type of estimate, for the typical monthly mortgage payment, can be obtained by multiplying the indexes by the prevailing 30 year mortgage rate (important note: this does not produce the actual monthly mortgage payment, but is a reasonably close estimate):

Here the news is much less alarming, as the typical monthly mortgage payment, while higher than a year ago, is nowhere near as high as it was during the housing bubble.
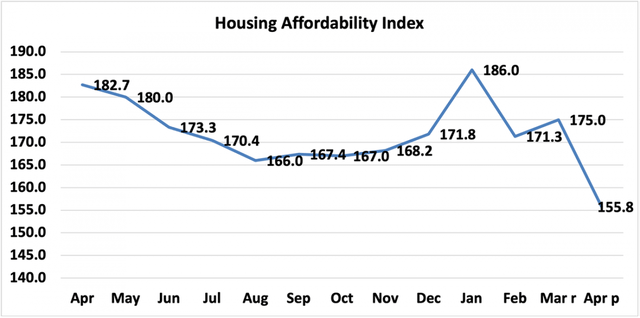
As a result, at 155.8, the NAR’s “housing affordability index” is close to its lowest (I.e., least affordable) reading since 2009, although it is higher than at any point during the housing bubble, when it was always below 150 and at its worst was just above 100:

An important difference vs. the housing bubble is that there were many speculators in the market, buying simply on the expectation that prices would continue to rise, i.e., “everyone knows house prices only go up!” This time around there is no evidence of such speculation, although obviously there is some panic buying for fear of being “forever priced out.”
We have already seen a downturn in sales. I do not believe this level of prices can be maintained for long.
