US natural gas hits highest price since 2008, closes at 7 1/2 year weekly high; European and Asian prices 5 times higher, Commenter RJS, Focus on Fracking Oil prices rose for a sixth consecutive week as rising global demand amid tight supplies more than offset higher US inventories . . . after rising 3.0% to .98 a barrel last week as U.S. crude inventories fell to a 35month low and as global oil supplies tightened, the contract price for US light sweet crude for November delivery opened higher on Monday on continuing signs that global oil inventories were falling sharply, and rose nearly 2% to close .47 higher at .45 a barrel, as parts of the globe, especially China and India, were seeing demand pick up with the easing of pandemic
Topics:
run75441 considers the following as important: climate change, energy, Focus on Fracking, Hot Topics, natural gas, RJS, US/Global Economics
This could be interesting, too:
NewDealdemocrat writes JOLTS revisions from Yesterday’s Report
Joel Eissenberg writes No Invading Allies Act
Joel Eissenberg writes How Tesla makes money
NewDealdemocrat writes January JOLTS report: monthly increases, but significant downward revisions to 2024
US natural gas hits highest price since 2008, closes at 7 1/2 year weekly high; European and Asian prices 5 times higher, Commenter RJS, Focus on Fracking
Oil prices rose for a sixth consecutive week as rising global demand amid tight supplies more than offset higher US inventories . . . after rising 3.0% to $73.98 a barrel last week as U.S. crude inventories fell to a 35month low and as global oil supplies tightened, the contract price for US light sweet crude for November delivery opened higher on Monday on continuing signs that global oil inventories were falling sharply, and rose nearly 2% to close $1.47 higher at $75.45 a barrel, as parts of the globe, especially China and India, were seeing demand pick up with the easing of pandemic conditions . . . oil prices moved higher early Tuesday, with Brent crude, the International oil benchmark, topping $80 per barrel for the first time since October 2018, as the global natural gas shortage stoked demand for oil as a substitute, before reversing those early gains and dropping to a 16 cent loss at $75.29 a barrel, weighed down by a rallying U.S. Dollar and a selloff in U.S. equity markets, triggered by default warnings from Treasury Secretary Janet Yellen…oil prices then extended their Tuesday losses in overnight trading after the American Petroleum Institute reported across-the-board builds in U.S. crude and petroleum product supplies and opened 91 cents lower on Wednesday, as a stronger U.S. dollar and concerns over a possible government default added further headwinds, before settling with a 46 cent, or a 0.6% loss at $74.83 a barrel, even as OPEC confirmed plans to maintain a deliberate approach to adding supply to the market. after the EIA confirmed the first increase in US supplies in eight weeks . . . but oil prices steadied on Thursday after a report that China was prepared to buy more oil and other energy supplies to meet growing demand offset the price pressure from the unexpected rise in U.S. crude inventories, and settled 20 cents higher after a volatile session at $75.03 a barrel, thus contributing to a sixth straight quarterly climb for U.S. benchmark prices . . . oil traded lower early Friday, after European manufacturing surveys indicated a sharp deceleration of growth in September, and as global equity markets extended their decline due to rattled supply chains and rising consumer prices, but rallied to close 85 cents higher at $75.88 a barrel amid reports OPEC+, due to meet on Monday, had discussed how to increase output faster in the coming months, and on word that the White House had spoken with Saudi Arabia about oil prices, and thus finished the week 2.6% higher, while posting a sixth straight weekly gain, the longest streak of weekly advances since early July…
Meanwhile, natural gas prices finished higher for the seventh straight week, as shortages in Europe and Asia drove prices to record levels . . . after inching up 0.7% to $5.140 per mmBTU last week as domestic and global supply problems outweighed the impact of bearish weather patterns, the contract price of natural gas for October delivery opened 1% higher on Monday and jumped 14% to $5.851 per mmBTU, before settling with an 11% gain on the day at $5.706 per mmBTU, as gas prices at or near record highs of around $26 per mmBTU in Europe and $28 in Asia kept demand for U.S. LNG exports strong . . . the rally continued into Tuesday, with October gas trading as high as $6.280 per mmBTU before settling with a 13.5 cent gain at a 7 1/2 year closing high of $5.841, as only the limited capacity of US LNG exports prevented US gas prices from following global prices to the moon, while the contract price of natural gas for November delivery, which was to take over as the prompt month on Wednesday, gained 14.9 cents to $5.880 per mmBTU . . . with markets now tracking the November contract, natural gas prices gave back half the week’s gains and tumbled 7% to $5.477 per mmBTU on Wednesday, the biggest one-day drop since January, on expectations that mild weather forecasts for the coming weeks would allow utilities to boost U.S. stockpiles to near-normal levels ahead of the winter heating season . . . but prices bounced back 39.0 cents or 7% to a new 7 year high of $5.867 per mmBTU on Thursday, despite a larger than normal injection of gas into storage, as fears that Europe would not have enough gas in storage for the winter heating season boosted global prices to record levels…but US gas prices came tumbling down again on Friday, and settled off 24.8 cents at $5.619 per mmBTU, as U.S. traders gave more weight to bearish domestic fundamentals than escalating fears of a global supply shortage this winter, but still finished the week 8.1% higher, the largest one week net and percentage gain since the week ending Aug. 27, and capping the largest six week gain since the week ending Feb. 21, 2014…
The seven year high for natural gas prices that we’ve cited has been widely reported by the media, but this week’s brief foray into prices above $6 appears to break this decade’s record high to test those of the last,
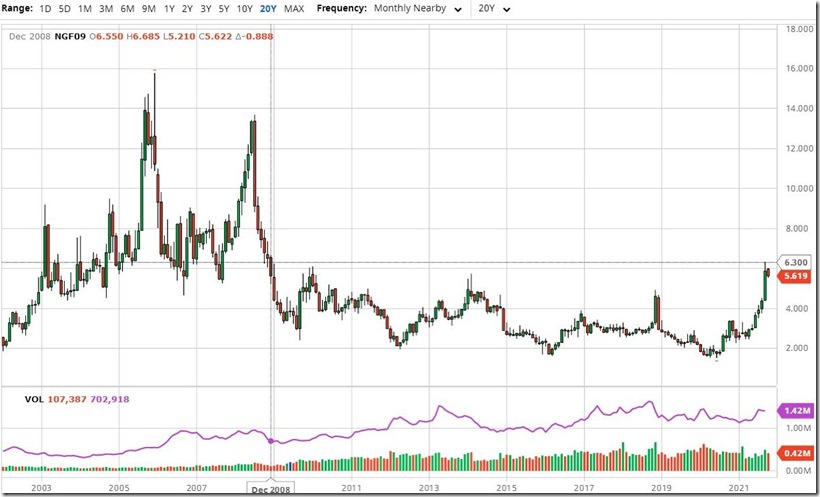
the above graph is a screenshot of the interactive natural gas price chart from barchart.com, which i have set to show front month natural gas prices monthly over the past 20 years, which means you’re seeing the range of natural gas prices over that time as they were quoted daily by the media…this same chart can be reset to show prices of front month or individual monthly natural gas contracts over time periods ranging from 1 day to 30 years, as the menu bar on the top indicates, and also to show natural gas prices by the minute, hour, day, week or month for each…each bar in the graph above represents the range of natural gas prices for a single month, with months when prices rose indicated in green, and months when prices fell indicated in red, with the small barely visible sticks above or below each monthly bar representing the extent of the price change above or below the opening and closing price for the month in question….likewise, the bars across the bottom show trading volume for the months in question, again with up months indicated by green bars and down months indicated in red…it’s clear that natural prices have risen well above the highs of the winter 2013 to 2014 period, so i’ve endeavored to position my cursor on the month when prices last hit the $6.280 per mmBTU level we saw on Tuesday of this week . . . that turned out to be December 2008, which you can see by the readout of that month which has been generated in small red print at the upper left of the graph, and which shows that the natural gas contract for January 2009 (NGF09) opened that month priced at $6.550 per mmBTU, and closed that month priced at $5.622 per mmBTU . . . although gas prices briefly touched $6.240 per mmBTU in January 2009, they hadn’t been above $6 since until this week..
IB: note that since the above is a monthly price graph, Friday’s 24.6 cent price drop, on October 1st, gets a monthly bar of its own, which is why the last bar shown points down, despite a weekly close that was at a 7 1/2 year high…
The EIA’s natural gas storage report for the week ending September 24th indicated that the amount of working natural gas held in underground storage in the US rose by 88 billion cubic feet to 3,170 billion cubic feet by the end of the week, which left our gas supplies 575 billion cubic feet, or 15.4% below the 3,745 billion cubic feet that were in storage on September 24th of last year, and 213 billion cubic feet, or 6.3% below the five-year average of 3,383 billion cubic feet of natural gas that have been in storage as of the 24th of September in recent years . . . the 88 billion cubic foot increase in US natural gas in working storage this week was close to the forecast for a 87 billion cubic foot addition expected by a survey of analysts by S&P Global Platts, but well more than the average addition of 72 billion cubic feet of natural gas that have typically been injected into natural gas storage during the same week over the past 5 years, and also more than the 74 billion cubic feet that were added to natural gas storage during the corresponding week of 2020…