Focus on Fracking: natural gas prices at a 7 1/2 year high; US crude supplies at a 23 month low, gasoline supplies at a 22 month low, Blogger RJS Natural gas prices also rose during the holiday shortened week as three-fourths of Gulf production still remained shut in as the weekend approached . . . after rising 7.8% to .712 per mmBTU last week on an unseasonably low inventory build while hurricane Ida disrupted both production and exports, the contract price of natural gas for October delivery opened lower and fell more than 3% on Tuesday, as new forecasts projected milder weather and firms continued efforts to restart facilities along the Gulf Coast, with gas settling down 14.4 cents at .568 per mmBTU…but natural gas prices jumped on
Topics:
run75441 considers the following as important: Focus on Fracking, Hot Topics, RJS, US/Global Economics
This could be interesting, too:
NewDealdemocrat writes JOLTS revisions from Yesterday’s Report
Joel Eissenberg writes No Invading Allies Act
Joel Eissenberg writes How Tesla makes money
NewDealdemocrat writes January JOLTS report: monthly increases, but significant downward revisions to 2024
Focus on Fracking: natural gas prices at a 7 1/2 year high; US crude supplies at a 23 month low, gasoline supplies at a 22 month low, Blogger RJS
Natural gas prices also rose during the holiday shortened week as three-fourths of Gulf production still remained shut in as the weekend approached . . . after rising 7.8% to $4.712 per mmBTU last week on an unseasonably low inventory build while hurricane Ida disrupted both production and exports, the contract price of natural gas for October delivery opened lower and fell more than 3% on Tuesday, as new forecasts projected milder weather and firms continued efforts to restart facilities along the Gulf Coast, with gas settling down 14.4 cents at $4.568 per mmBTU…but natural gas prices jumped on Wednesday, spiking to a 10% gain over $5 at one point, on a warmer than normal forecast for the eastern half of the nation, and closed 34.6 cents or 7.6% higher at $4.914 per mmBTU as traders mulled ongoing production outages in the Gulf, robust domestic demand, and intensifying competition for US LNG exports . . . natural gas prices rose another 11.7 cents to a 7 year closing high of $5.031 per mmBTU on Thursday, despite forecasts for less hot weather next week and a bigger than expected storage build, as hefty production outages lingered following Hurricane Ida, creating more uncertainty about whether U.S. supplies would be sufficient for the winter . . . but prices pulled back on Friday, slipping from their 7-year high despite record prices globally, and ending down 9.3 cents at $4.938 per mmBTU, as traders took profits following the frenzied rally that saw the front month contract surge more than 10% over the two prior trading sessions . . . despite that Friday retreat, natural gas prices still finished 4.8% higher on the week, and ended with the highest weekly close since February 2014…
With a new interim high for natural gas prices, we’ll include a graph of their history that takes in the last time prices have reached this level:
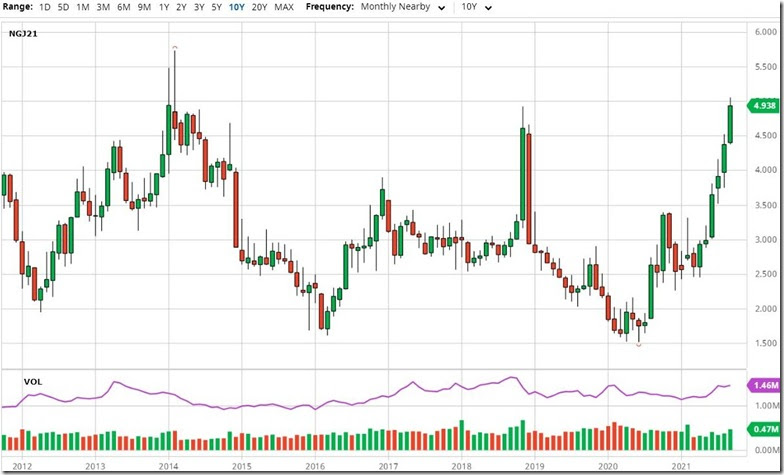
the above is a screenshot of the interactive natural gas price chart from barchart.com, which i have set to show front month natural gas prices monthly over the past 10 years, which means you’re seeing the range of natural gas prices over that time as they were quoted by the media…this same chart can be reset to show prices of front month or individual monthly natural gas contracts over time periods ranging from 1 day to 30 years, as the menu bar on the top indicates, and also to show natural gas prices by the minute, hour, day, week or month for each . . . each bar in the graph above represents the range of natural gas prices for a single month, with weeks when prices rose indicated in green, and weeks when prices fell indicated in red, with the small sticks above or below each monthly bar representing the extent of the price change above or below the opening and closing price for the month in question . . . likewise, the bars across the bottom show trading volume for the weeks in question, again with up weeks indicated by green bars and down weeks indicated in red . . . it’s clear that prices have now risen well above the price spike during the November-December 2018 period, and it almost looks as if they are exceeding the 2014 highs . . . but since this graph is monthly (necessitated due to the 10 year span it covers), those mid-February 2014 days when prices exceeded this week’s prices aren’t clearly shown…but if you go to the interactive 10 year graph itself at barchart.com, you can see that February 2014 saw natural gas prices rise as high as $5.737 per mmBTU, well above this week’s high…
The EIA’s natural gas storage report for the week ending September 3rd indicated that the amount of working natural gas held in underground storage in the US rose by 52 billion cubic feet to 2,923 billion cubic feet by the end of the week, which left our gas supplies 592 billion cubic feet, or 16.8% below the 3,515 billion cubic feet that were in storage on September 3rd of last year, and 235 billion cubic feet, or 7.4% below the five-year average of 3,158 billion cubic feet of natural gas that have been in storage as of the 3rd of September in recent years…the 52 billion cubic foot increase in US natural gas in working storage this week was was well above the median forecast for a 33 billion cubic foot addition forecast by a S&P Global Platts’ survey of analysts, but was less than the average addition of 65 billion cubic feet of natural gas that have typically been injected into natural gas storage during the same week over the past 5 years, as well as less than the 65 billion cubic feet that were added to natural gas storage during the corresponding week of 2020…