New home sales decline in April, revised sharply lower for March; prices continue to skyrocket, while inventory increases This morning both new home sales and two price indexes for houses were released for April, completing our view of that important long leading sector. As anticipated, not only did new home sales decline for the month, but March was also hugely revised to the downside ( over 10%!): Figure 1 With these revisions, the peak for new home sales becomes the December-January period, exactly as is the case for housing permits, starts, and existing home sales. But if sales are down, prices are continuing to skyrocket: As measured by the FHFA, prices increased 1.4% seasonally adjusted just in the past month! YoY
Topics:
NewDealdemocrat considers the following as important: Housing Prices, inventory, US EConomics
This could be interesting, too:
NewDealdemocrat writes JOLTS revisions from Yesterday’s Report
Bill Haskell writes The North American Automobile Industry Waits for Trump and the Gov. to Act
Bill Haskell writes Families Struggle Paying for Child Care While Working
Joel Eissenberg writes Time for Senate Dems to stand up against Trump/Musk
New home sales decline in April, revised sharply lower for March; prices continue to skyrocket, while inventory increases
This morning both new home sales and two price indexes for houses were released for April, completing our view of that important long leading sector.
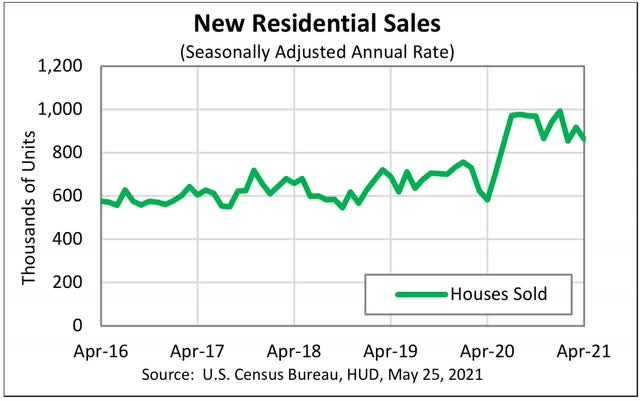
As anticipated, not only did new home sales decline for the month, but March was also hugely revised to the downside ( over 10%!):
 Figure 1
With these revisions, the peak for new home sales becomes the December-January period, exactly as is the case for housing permits, starts, and existing home sales.
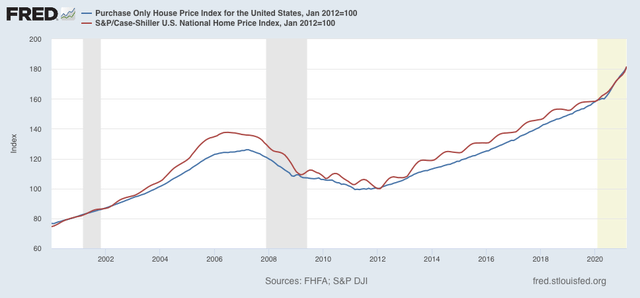
But if sales are down, prices are continuing to skyrocket:

As measured by the FHFA, prices increased 1.4% seasonally adjusted just in the past month! YoY they are up 13.9%. For the Case Shiller national index, the monthly change was +2.0%, and the YoY change was +13.2%.
Housing inventory is increasing again, up about 3% m/m and now only down about 2% YoY, vs. a trough of being down over 12% YoY.
I’ll have more later at Seeking Alpha.
