And gasoline exports at a 26 month low . . . Blogger and Commenter R.J.S., Focus on Fracking: “Oil price is highest since 2014; natural gas price fell from 12 year high after largest inventory increase in 16 months” Oil prices finished higher for the 7th straight week after OPEC decided to only add the minimum to global supplies in the coming months . . . after rising 2.6% to .88 a barrel last week as rising global demand amid tight supplies more than offset higher US inventories, the contract price for US light sweet crude for November delivery jumped early on Monday after reports emerged the Joint Ministerial Monitoring Committee of the OPEC+ alliance had recommended oil producers stick to their current plan and ease their cuts by just
Topics:
run75441 considers the following as important: Focus on Fracking, inventory, natural gas, oil prices, politics, RJS, US/Global Economics
This could be interesting, too:
Robert Skidelsky writes Lord Skidelsky to ask His Majesty’s Government what is their policy with regard to the Ukraine war following the new policy of the government of the United States of America.
Joel Eissenberg writes No Invading Allies Act
Ken Melvin writes A Developed Taste
Bill Haskell writes The North American Automobile Industry Waits for Trump and the Gov. to Act
and gasoline exports at a 26 month low . . .
Blogger and Commenter R.J.S., Focus on Fracking: “Oil price is highest since 2014; natural gas price fell from 12 year high after largest inventory increase in 16 months”
Oil prices finished higher for the 7th straight week after OPEC decided to only add the minimum to global supplies in the coming months . . . after rising 2.6% to $75.88 a barrel last week as rising global demand amid tight supplies more than offset higher US inventories, the contract price for US light sweet crude for November delivery jumped early on Monday after reports emerged the Joint Ministerial Monitoring Committee of the OPEC+ alliance had recommended oil producers stick to their current plan and ease their cuts by just 400,000 barrels per day, and then rocketed to a 7 year high after OPEC and other producers doubled down on their earlier plans to increase oil output at a gradual rate, before settling $1.74 higher at $77.62 a barrel, still the highest closing price since 2014 . . . the oil price rally on the OPEC decision continued on Tuesday, with the November contract price rising another $1.31 to another 7 year high at $78.93 a barrel, with crude prices also supported by a Goldman forecast that power generation could add an extra 650,000 barrels a day to oil demand this winter as record global natural gas prices incentivize power generators to switch from gas to oil . . . however, oil prices dipped in overnight trading after the American Petroleum Institute reported the 2nd straight week of unexpected inventory builds, and then slid from its prior seven year high early Wednesday on that API report, and on Saudi Arabia’s decision to cut nearly all of its November crude prices for Asia, European and U.S.-bound cargoes, and then went on to settle $1.50 or 2% lower at $77.43 a barrel, after the EIA confirmed the API’s report of higher inventories and Russian President Vladimir Putin indicated that his country would ramp up natural gas exports to help stabilize European energy markets . . . oil prices extended thier losses from the previous session on Thursday, falling below $75 a barrel, after Energy Secretary Jennifer Granholm said the US was considering selling oil from its strategic reserves, and as Russia said it was ready to stabilize the natural gas market, but rallied in the afternoon to settle 87 cents higher at $78.30 a barrel after the U.S. Department of Energy walked back their plans for an SPR release and an export ban and after Biden’s national security adviser urged energy suppliers to lift flows to meet demand, saying that the United States is concerned about their failure to do so . . . oil prices continued rising overnight with the return of China to the markets, and opened 56 cents higher in New York on Friday, and then jumped to over $80 a barrel for the first time since October 2014 on a retreat in the U.S. dollar index, triggered by a weaker-than-expected September employment report, before settling $1.05 higher on the day at $79.35 a barrel, as the global energy crunch boosted U.S. prices to their highest in almost seven years as big power users struggled to meet demand . . . oil prices thus finished the week with a 4.6% increase, at their highest since October 31st, 2014,
With several news sites citing a “7 year high” for oil prices on Monday, Tuesday, and again on Friday, we’ll put up a longer term oil price graph to see what that looks like….
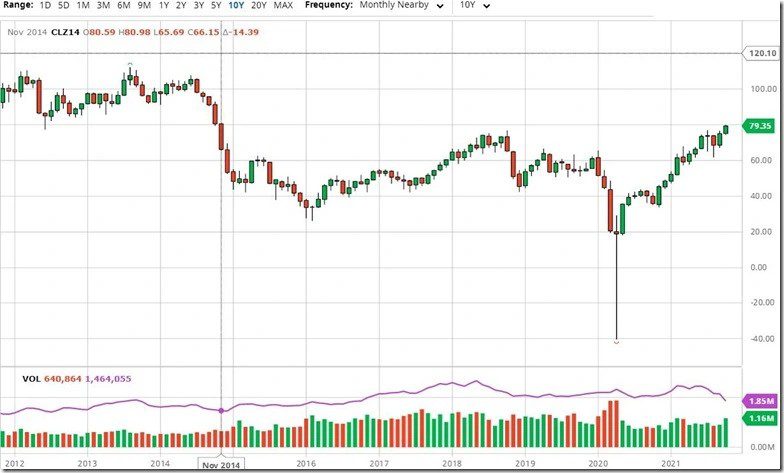
current interactive oil price chart from barchart.com
The above is a screenshot of the current interactive (follow the link) oil price chart from barchart.com, which I have set to show front month oil prices monthly over the past 10 years, which means you’re seeing the same oil prices that were quoted by the media . . . this same chart can be reset to show prices of front month or individual monthly oil contracts over time periods ranging from 1 day to 30 years, as the menu bar on the top indicates, and also to show oil prices by the minute, hour, day, week or month for each . . . each bar in the graph above represents the range of oil prices for a single month, with months when prices rose indicated in green, with the opening price at the bottom of the bar and the closing price at the top, and months when prices fell indicated in red, with the opening price at the top of the bar and the closing price at the bottom, while the small barely visible sticks above or below each monthly bar represent the extent of the price change above or below the opening and closing price during the month in question . . . likewise, the bars across the bottom show trading volume for the front month oil contract, for the months in question, again with up months indicated by green bars and down months indicated in red….
To find the month when oil prices were last as high as this week’s, i’ve maneuvered my cursor to the month when prices were last at the $80 a barrel level we saw on Friday of this week . . . that turned out to be November 2014, which you can see by the readout of that month which has been generated by my cursor in small red print at the upper left of the graph, and which shows that the ‘crude light’ oil contract for December 2014 (CLZ14) opened that month priced at $80.59 a barrel, and closed that month priced at $66.16 a barrel . . . while that would seem to indicate that oil saw prices above this week’s high of $80.11 a barrel early in November of 2014, i’d note that the Wall Street Journal affiliate website Marketwatch puts the date at October 31st, 2014 . . . it could be that they are citing a different oil contract than the CLZ14 contract this graph shows for November . . . whatever the case, while one could say oil prices were at a 7 year high, we can see that the last time oil prices were as high at they were this week was just short of seven years ago…
Meanwhile, natural gas prices finished lower for the first time in the past eight weeks on the largest increase in US natural gas inventories in over a year . . . after rising 8.1% to $5.619 per mmBTU last week as natural gas shortages in Europe and Asia drove their prices to record levels, the contract price of natural gas for November delivery opened higher on Monday and rose 14.7 cents to $5.766 per mmBTU, on forecasts that power generators would burn more of the fuel during the week than was previously expected, as lingering heat was still expected to keep A/C demand high in some parts of the country…US prices then surged 54.6 cents or 9.5% to $6.312 per mmBTU on Tuesday, as prices in Europe rocketed over 21% for November gas and by 23% for December gas to fresh record highs, on worries European countries would not have enough natural gas stored for winter, as China and other Asian LNG buyers bid up prices for available cargoes…while US prices opened higher again on Wednesday, they quickly dropped 63.7 cents or over by more than 10% to $5.675 per mmBTU, after Vladimir Putin said Russia was ready to pump more gas to help stabilize European energy markets and US traders shifted focus back to domestic markets, where expectations were supplies had grown more than normal for a fourth week in a row . . . however, even after the EIA reported more natural gas had been added to storage than anyone had expected, natural gas prices ended Thursday virtually unchanged, settling up just two-tenths of a cent at $5.677 per mmBTU . . . US natural gas prices then slid 11.2 cents to $5.565 per mmBTU on Friday, on a drop in global gas prices and on forecasts for mild weather to keep heating demand at a minimum through late October, thus ending 1.0% lower for the week…
The EIA’s natural gas storage report for the week ending October 1st indicated that the amount of working natural gas held in underground storage in the US rose by 118 billion cubic feet to 3,288 billion cubic feet by the end of the week, which still left our gas supplies 532 billion cubic feet, or 13.9% below the 3,820 billion cubic feet that were in storage on October 1st of last year, and 176 billion cubic feet, or 5.1% below the five-year average of 3,464 billion cubic feet of natural gas that have been in storage as of the1st of October in recent years . . . the 118 billion cubic foot increase in US natural gas in working storage this week was the largest weekly addition to storage since June 19th of last year, was more than the forecast for a 111 billion cubic foot addition from a survey of analysts queried by S&P Global Platts, and well more than the average addition of 81 billion cubic feet of natural gas that have typically been injected into natural gas storage during the same week over the past 5 years, and also well more than the 75 billion cubic feet that were added to natural gas storage during the corresponding week of 2020…