Record 9.6% Annual Increase in November Producer Price Index; Record 6.9% YoY Increase in Core Prices; Record 7.1% YoY Increase for Final Demand Services, Record 14.9% Increase for Final Demand Goods, and a 46+ year Record for Prices of Intermediate Goods, RJS, MarketWatch 666 The seasonally adjusted Producer Price Index (PPI) for final demand rose 0.8% in November, as prices for finished wholesale goods rose 1.2% while margins of final services providers were 0.7% higher…that increase followed a revised 0.6% increase in October, when prices for finished wholesale goods rose 1.3% while margins of final services providers were 0.2% higher, a revised 0.6% increase in September, when prices for finished wholesale goods rose 1.1% while margins of final
Topics:
run75441 considers the following as important: Hot Topics, MarketWatch 666, RJS, US/Global Economics
This could be interesting, too:
NewDealdemocrat writes JOLTS revisions from Yesterday’s Report
Joel Eissenberg writes No Invading Allies Act
Joel Eissenberg writes How Tesla makes money
NewDealdemocrat writes January JOLTS report: monthly increases, but significant downward revisions to 2024
Record 9.6% Annual Increase in November Producer Price Index; Record 6.9% YoY Increase in Core Prices; Record 7.1% YoY Increase for Final Demand Services, Record 14.9% Increase for Final Demand Goods, and a 46+ year Record for Prices of Intermediate Goods, RJS, MarketWatch 666
The seasonally adjusted Producer Price Index (PPI) for final demand rose 0.8% in November, as prices for finished wholesale goods rose 1.2% while margins of final services providers were 0.7% higher…that increase followed a revised 0.6% increase in October, when prices for finished wholesale goods rose 1.3% while margins of final services providers were 0.2% higher, a revised 0.6% increase in September, when prices for finished wholesale goods rose 1.1% while margins of final services providers were 0.4% higher, a revised 0.6% increase in August, when prices for finished wholesale goods rose 0.9% and margins of final services providers rose 0.5%, and a re-revised July report that indicated the PPI was 0.9% higher, as prices for finished wholesale goods rose 0.5% while margins of final services providers rose 1.0%….on an unadjusted basis, producer prices are a record 9.6% higher than a year ago, up from the upwardly revised 8.8% year over year increase now shown for October’s producer prices, while the core producer price index, which excludes food, energy and trade services, rose by 0.7% for the month, and is now a record 6.9% higher than in a year ago, up from the upwardly revised 6.3% year over year increase that was indicated in October…beginning with this release, producer price index values are being computed to 3 decimal places and the data will continue to be revised for four months after initial publication; hence, all changes we’ll quote today will reflect those revisions….

As we noted, the price index for final demand for goods, previously called ‘finished goods’, was 1.2% higher in November, after being 1.3% higher in October. 1.1% higher in September, 0.9% higher in August, 0.7% higher in July, 1.2% higher in June, 1.5% higher in May, 0.7% higher in April, 1.5% higher in March, 1.6% higher in February, 1.6% higher in January, 0.9% higher in December, and 0.4% higher in November of last year, and hence is now up by a record 14.85% from a year ago….the finished goods price index rose 1.2% in November as the price index for wholesale energy goods was 2.6% higher, after it had risen by a revised 5.3% in October, 2.1% in September, by 0.6% in August, and by 2.4% in July, and as the price index for wholesale foods rose 1.2%, after falling by a revised 0.3% in October, rising by revised a 2.2% in September, by 2.1% in August, but after falling by a revised 1.3% in July, while the index for final demand for core wholesale goods (excluding food and energy) was 0.8% higher, after it had risen by 0.6% in October and by 0.5% in September…wholesale energy prices averaged 2.6% higher on a 7.3% increase in wholesale prices for gasoline, a 6.8% increase in wholesale prices for jet fuel, and a 2.0% increase in wholesale prices for residential natural gas, while the wholesale food price index rose 1.2% on 20.1% increase in the wholesale price index for fresh fruits and melons, an 11.5% increase in the wholesale price index for fresh and dry vegetables, a 6.3% increase in the wholesale price index for grains, and a 2.1% increase in the wholesale price index for pasta products….among core wholesale goods, the wholesale price index for iron and steel scrap rose 10.7%, the wholesale price index for mining machinery and equipment rose 5.8%, the wholesale price index for transformers and power regulators rose 5.5%, the wholesale price index for railroad equipment rose 3.7%, the wholesale price index for footwear rose 2.6%, the wholesale price index for travel trailers and campers rose 2.8%, and the wholesale price index for industrial chemicals rose 2.5%….
At the same time, the index for final demand for services rose 0.7% in November, after rising 0.2% in October, a revised 0.4% in September, a revised 0.5% in August, and by a revised 1.0% in July, and is now up by a record 7.1% from a year ago, up from the 5.9% year over year increase that was indicated in October….the index for final demand for trade services rose 0.6% and the index for final demand for transportation and warehousing services rose 1.9%, while the core index for final demand for services less trade, transportation, and warehousing services was 0.6% higher… among trade services, seasonally adjusted margins for fuels and lubricants retailers rose 8.3%, margins for lawn, garden, and farm equipment and supplies retailers rose 4.1%, margins for cleaning supplies and paper products retailers rose 5.9%, margins for flooring and floor coverings retailers rose 3.7%, and margins for furniture retailers rose 3.4%, while margins for TV, video, and photographic equipment and supplies retailers fell 10.4%…among transportation and warehousing services, average margins for airline passenger services rose 5.1%, margins for air transportation of freight rose 1.3%, margins for truck transportation of freight rose 1.0% and margins for courier, messenger, and U.S. postal services rose 0.7%…among the components of the core final demand for services index, the price index for price index for traveler accommodation services rose 5.1%, the price index for securities brokerage, dealing, investment advice, and related services rose 6.1%, the price index for portfolio management rose 2.9%, and the price index for gaming receipts rose 3.5%…
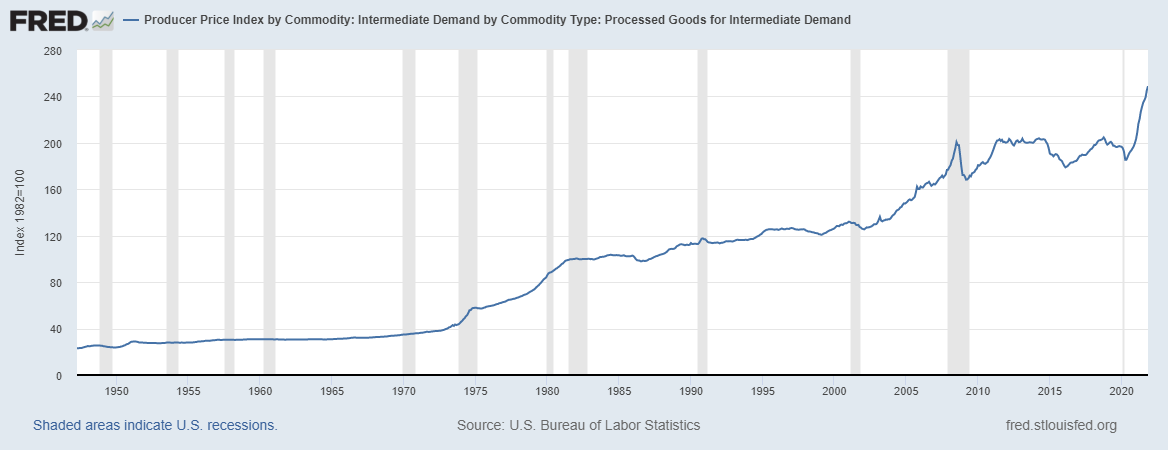
This report also showed the price index for intermediate processed goods rose 1.5% in November, after rising a revised 2.4% in October, a revised 1.1% in September, a revised 0.9% in August, a revised 1.6% in July, 1.8% in June, and rising 2.9% in May, 1.9% in April, 3.5% in March, 2.9% in February, and 1.8% in January, 1.4% in December, and 0.9% in November of last year….the price index for intermediate energy goods rose 3.6% in November, as producer prices for natural gas sold to electric utilities rose 27.7%, producer prices for industrial natural gas rose 2.6%, refinery prices for gasoline rose 7.3%, refinery prices for jet fuel rose 6.8%, and refinery prices for residual fuels rose 4.3%… meanwhile, the price index for intermediate processed foods and feeds fell 0.2%, as the producer price index for processed poultry fell 3.3%, the producer price index for prepared animal feeds fell 0.3%, and the producer price index for processed fruits and vegetables fell 0.2%…at the same time, the core price index for intermediate processed goods less food and energy goods rose 1.2%, as the producer price index for softwood lumber rose 6.9%, the producer price index for plywood rose 2.9%, the producer price index for steel mill products rose 2.4%, the producer price index for fabricated structural metal products rose 2.8%, the producer price index for motors, generators, motor generator sets rose 3.2%, the producer price index for secondary nonferrous metals rose 3.8%, the producer price index for asphalt felts and coatings rose 2.8%, the producer price index for paint materials rose 4.3%, the producer price index for basic organic chemicals rose 2.6%, the producer price index for phosphates rose 4.9%, and the producer price index for nitrogenates rose 9.2%, while the producer price index for primary nonferrous metals fell 3.9% …average prices for intermediate processed goods are now 26.5% higher than in November a year ago, the largest year over year price increase since the year ended December 1974, but just the twelfth increase after 19 consecutive year over year decreases, which had followed 29 months of year over year increases, which had been preceded by 16 months of negative year over year comparisons, as prices for intermediate goods fell every month from July 2015 through March 2016….
Meanwhile, the price index for intermediate unprocessed goods rose rose 4.8% in October, after rising by a revised 5.5% in October. a revised 2.7% in September, a revised 1.8% in August, a revised 2.9% in July, amd rising by 1.8% in June, by 7.2% in May, and by 2.0% in April, after falling by 4.2% in March, but after rising by 11.9% in February, and by 5.3% in January, 2.1% in December, and by 6.3% last November….that was as the November price index for crude energy goods rose 8.7% as crude oil prices rose 3.8%, unprocessed natural gas prices rose 14.3%, and coal prices rose 1.8%, while the price index for unprocessed foodstuffs and feedstuffs fell 0.7% on a 10.3% decrease in producer prices for raw milk, a 3.7% decrease in producer prices for slaughter hogs, a 6.2% decrease in producer prices for slaughter chickens, a 6.7% decrease in producer prices for slaughter turkeys, and a 1.8% decrease in producer prices for oilseeds, while producer prices for wheat rose 6.6% and producer prices for corn rose 6.1%…at the same time, the index for core raw materials other than food and energy materials was 4.5% higher, as the price index for raw cotton rose 12.9%, the price index for nonferrous metal ores rose 5.3%. and the price index for iron and steel scrap rose 10.7%….this raw materials index is now 52.5% higher than a year ago, down from the 54.9% year over year increase in October and the record 59.2% increase in April, and just the thirteenth year over year increase for this index after the annual change on this index had been negative from the beginning of 2019 through October of last year…
Lastly, the price index for services for intermediate demand rose 0.6% in November, after rising a revised 0.1% in October, a revised 0.6% in September, a revised 0.1% in August, a revised 0.6% in July, and rising by 1.2% in June, by 0.6% in May, by 1.3% in April, by 0.6% in March, by 0.3% in February, by 1.1% in January, and by 0.7% in December 2020, but after being unchanged last November….the price index for intermediate trade services was unchanged, as margins for intermediate machinery and equipment parts and supplies wholesalers rose 0.4% and margins for intermediate automotive parts and tire retailers rose 0.6%, while margins for intermediate building materials, paint, and hardware wholesalers fell 1.4% and margins for intermediate hardware, building material, and supplies retailers fell 1.6%…meanwhile, the index for transportation and warehousing services for intermediate demand was 0.7% higher, as the intermediate price index for transportation of passengers rose 5.0%, the intermediate price index for air transportation of freight rose 1.3%, the intermediate price index for truck transportation of freight rose 1.0%, and the intermediate price index for air mail and package delivery services excluding those by USPS rose 1.7%….at the same time, the core price index for intermediate services other than trade, transportation, and warehousing services rose 0.8%, as the intermediate price index for securities brokerage, dealing, investment advice and related services rose 6.1%, the intermediate price index for radio advertising time sales rose 6.1%, the intermediate price index for television advertising time sales rose 5.3%, the intermediate price index for truck, utility trailer, and RV rental and leasing rose 4.1%, the intermediate price index for traveler accommodation services rose 5.1%, and the intermediate price index for portfolio management rose 2.9%…over the 12 months ended in November, the year over year price index for services for intermediate demand is now 8.1% higher than it was a year ago, the fourteenth consecutive positive annual increase in this index change since it briefly turned negative year over year from April to August of last year, but is still down from the record 9.5% year over year increase now shown for July….